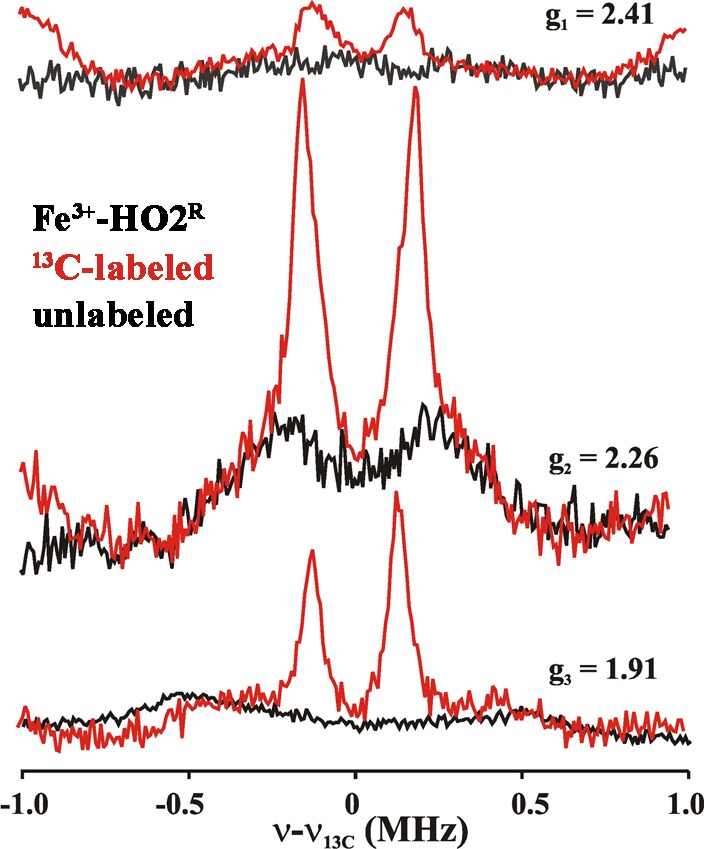
Figure 11.

13C MIMS ENDOR spectra of Fe3+-HO2R. Unlabeled (black), 13C-labeled (red). The spectra are recorded at the field positions mentioned by g-values. Experimental conditions; MW freq = 34.8 GHz, T = 2 K. pulse sequence used as discussed in Methods. tp = 50 ns, τ = 700 ns, trf = 20 μs, trep = 20 ms, no of points 256, transients/scan.
