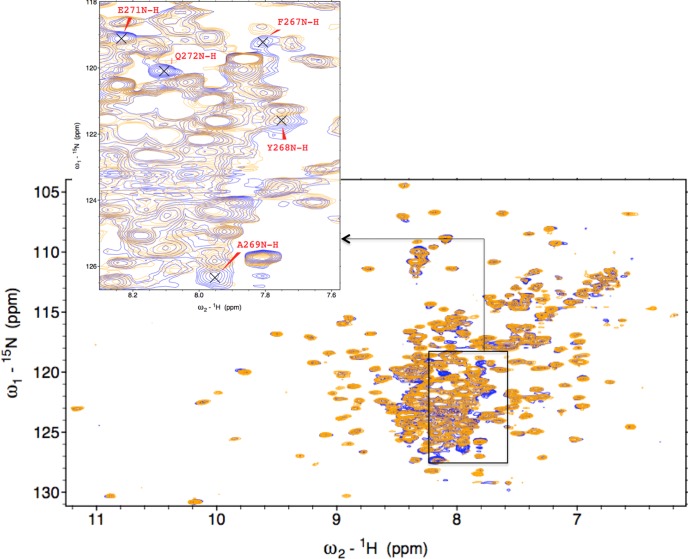
Figure 6.
1H- 15N TROSY overlay of the ZnPP-bound HO2O (blue) and HO2R (orange). Inset shows residues that have completely disappeared in the HO2R spectrum. These are the same residues in the C-terminal region around Cys265 as those monitored for Fe3+-HO2R. HO2 was present at a concentration of approximately 200 μM each in 50 mM Tris, 50 mM KCl, pH 7.0 buffer.

