
Figure 7.
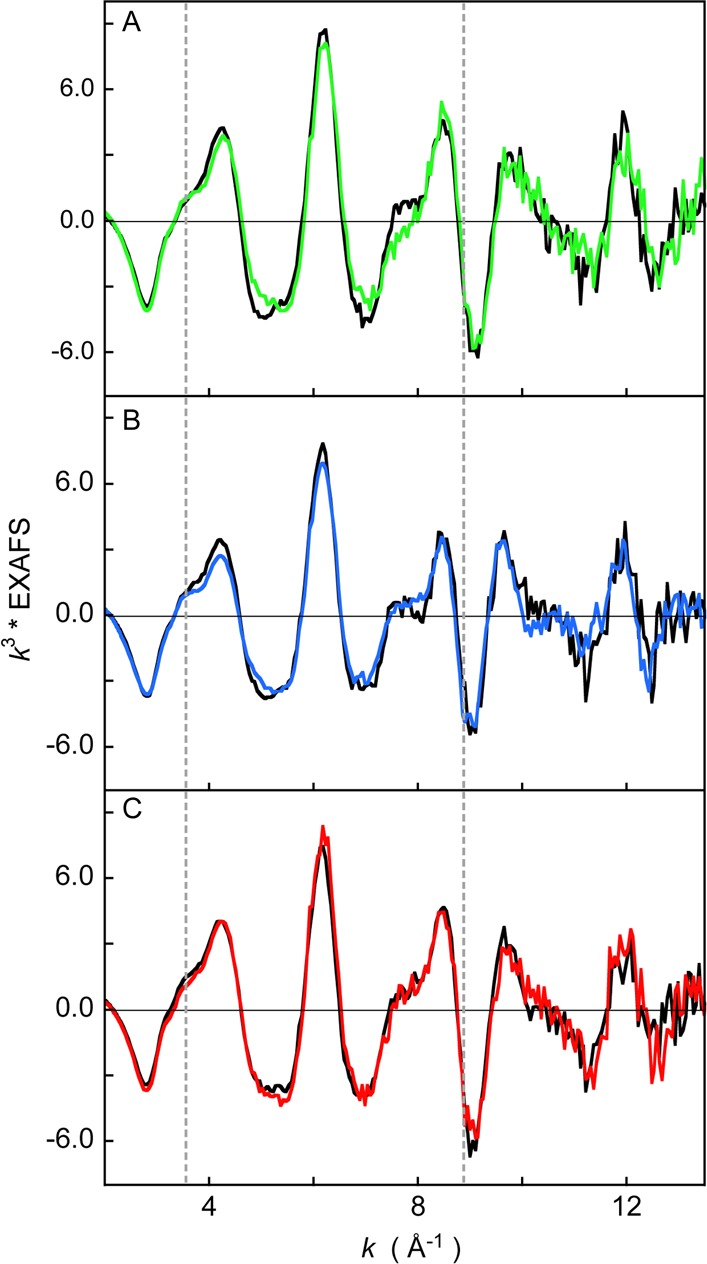
A comparison of k3-weighted EXAFS data of (A) WT Fe3+-HO2° (green line), WT Fe3+-HO2R (black line), (B) C127A/C265A Fe3+-HO2O (blue line), C127A/C265A Fe3+-HO2R (black line), and (C) C127A/C282A Fe3+-HO2O (red line), C127A/C282A Fe3+-HO2R (black line).