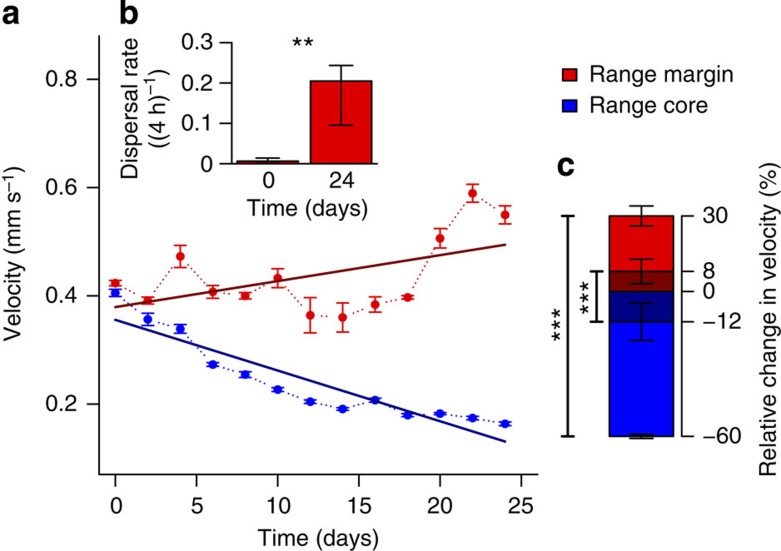
Figure 1. Experimental evolution of dispersal and movement strategies across six replicated range expansions.
(a) Change in movement velocity of individuals in the range core and at the range margin (mean±s.e.; six replicates) over the experimental time period. Dark lines are LMM fits (time: N=156, df=150.72, t=5.75, P<0.001; range position: N=156, df=150.73, t=−1.41, P=0.16; time-range position interaction: N=156, df=150.73, t=−12.0, P<0.001). (b) Dispersal rates (proportion individuals dispersed) significantly increased in the populations at the range margin between day 0 and 24 (median and quartiles; GLMM: N=12, z=2.69, P=0.007), showing that increased velocity translates into higher dispersal rates. (c) The observed differences in movement velocity at the end of the evolution experiment (30% increase at the range margin and 60% decrease in the range core, mean±s.e.; total height of the bars, that is, dark and light coloured areas) remained significant after two days (∼10 doubling time periods) of common garden (8% increase and 12% decrease, only darker shaded area of the bars; LMM, time: N=24, df=6.32, t=1.14, P=0.3; range position: N=24, df=14.94, t=2.11, P=0.052; time-range position interaction: N=24, df=14.94, t=−4.25, P<0.001). Stars indicate significance levels (*: <0.05, **: <0.01, ***: <0.001).

