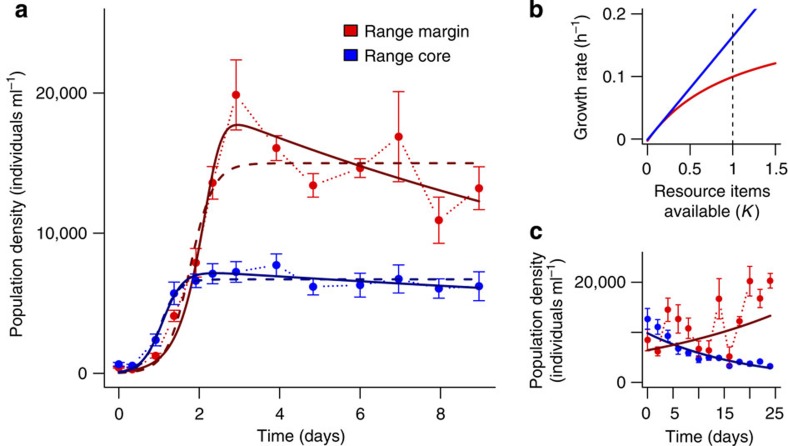
Figure 2. Evolution of growth and competitive ability.
(a) Growth curves (mean±s.e.; six replicates) for populations in the range core and at the range margin measured after the end of the experimental evolution phase and two days of common garden (∼10 doubling time periods) are better explained by a consumer–resource model (continuous lines; Rosenzweig–MacArthur model including logistic resource growth and a type II functional response for the consumers) than by logistic growth only (dashed lines; ΔAIC(core)=3.19, ΔAIC(margin)=4.87). (b) Growth rates (fitness) inferred from the consumer–resource model fitted in a as a function of the availability of resources. Individuals in range core populations (blue) exhibited higher growth rates than individuals at the range margin (dashed line: resource carrying capacity). These differences were mainly due to changes in foraging success. Note that the x axis is in units of resource carrying capacity. (c) The significantly higher population densities during the range expansion (mean±s.e.; GLMM, time: N=156, z=3.00, P=0.003; range position: N=156, z=2.20, P=0.028; time-range position interaction: N=156, z=−6.00, P<0.001) at the range margin compared with the range core are most likely the consequence of changes in growth rates (fitness) shown in b.

