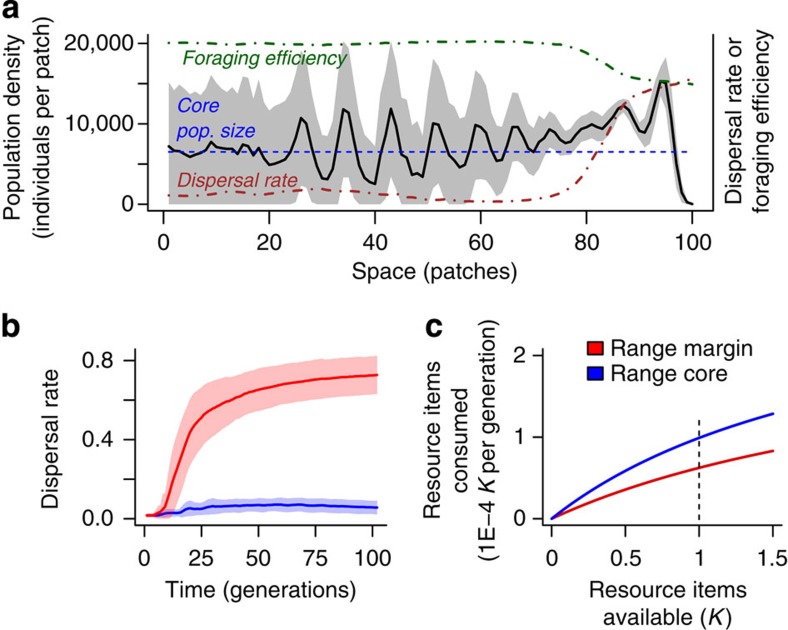
Figure 3. Numerical analyses exploring the concurrent evolution of dispersal and foraging efficiency.
(a) The spatial density profile (black line, grey shading; mean±s.d., 100 replicate simulations) shows high population densities at the range margin (approximately patches 75–100) in comparison with the range core (approximately. patches 0–20). This phenomenon is not due to spatial oscillations resulting from higher resource availability at range margins (compare mean range core density with dynamics at the range margin; blue dashed line). The density profile results from the evolution of higher dispersal rates at the range margin (brown dotted-dashed line; see b for temporal dynamics), which trades off against foraging efficiency (type II functional response; green dashed-dotted line; see also c). Parameters: amax=0.03; e=700; 1/bmax=0.02; λ0=4; K=50; μ=0; dmax=3.

