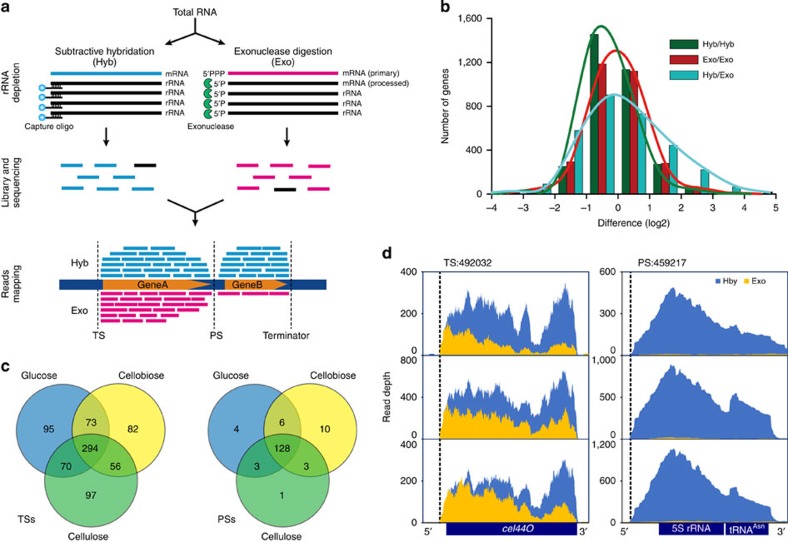
Figure 1. Genome-wide map of transcription start sites (TSs) and post-transcription start sites (PSs) in Clostridium cellulolyticum.
(a) Two strategies were applied for purification of mRNA from total RNA (Methods). The primary and processed transcripts can be distinguished by comparison of results between the two methods. A transcript that has undergone processing would be characterized by a much lower level of transcript under Exo than under Hyb, whereas a transcript without undergoing processing would feature equivalent transcript level between the two libraries. Moreover, locations of the start of a primary transcript are indicated by an elevated and sharp 5′ flank under both Exo and Hyb, whereas the post-transcriptional processed-sites are indicated by an elevated and sharp 5′ flank under Hyb yet a much lower transcript level in the downstream flanking regions under Exo. (b) Histogram indicated, under cellulose, differences of transcript abundance between the two biological replicates of Hyb or Exo, or between Hyb and Exo. Compared with the symmetric distribution observed between biological replicates, the difference between Hyb and Exo exhibits dissymmetry distribution, suggesting certain genes are of lower transcript abundance in Exo than Hyb (due to the sensitivity of processed transcripts to exonuclease). (c) TSs and PSs identified under the culture conditions of cellulose, cellobiose or glucose. Their overlaps were showed via Venn diagram. (d) Transcription profiles of the primary transcript of cel44O and the processed transcript of 5S rRNA-tRNAAsn. Exonuclease treatment (Exo) shifts the cel44O cDNAs towards the nuclease-protected 5′ end, yielding a sawtooth-like profile with an elevated sharp 5′ flank. In contrast, the processed 5′ end of 5S rRNA is predominant in the Hyb.

