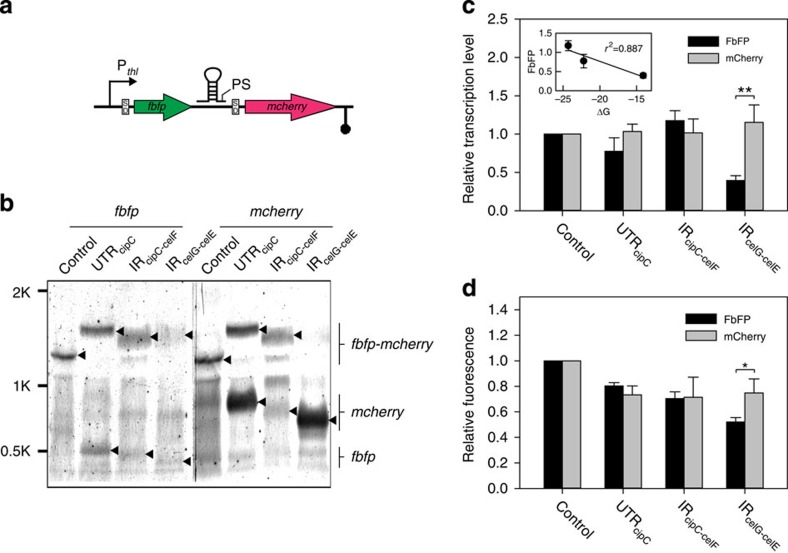
Figure 6. Functional analysis of iPS-proximal stem-loops located in the cip-cel operon via fbfp-mcherry artificial operon.
(a) Schematic representation of the dual-fluorescence reporter system for functional analysis of stem-loop structures. (b) Northern blotting results that yield the size and abundance of transcripts that harboured fbfp, mcherry or both. Black triangle arrows highlight positions of bands that corresponded to the transcripts as indicated on the right side of the panel. (c) The relative transcription level of fbfp and mcherry as measured by qPCR. Data were normalized via the transcript level of the corresponding gene in the control, which does not harbour any iPS proximal sequences. The inset shows the strong correlation between the transcript level of FbFP and ΔG of the inserted stem-loops (r2=0.887). (d) The fluorescence intensity of FbFP and mCherry proteins as normalized by OD600. Data were then normalized via the fluorescence in the control. Error bars indicate s.d. of mean of experiments in triplicate (*P value<0.01, **P value<0.0001; Student's t-test).

