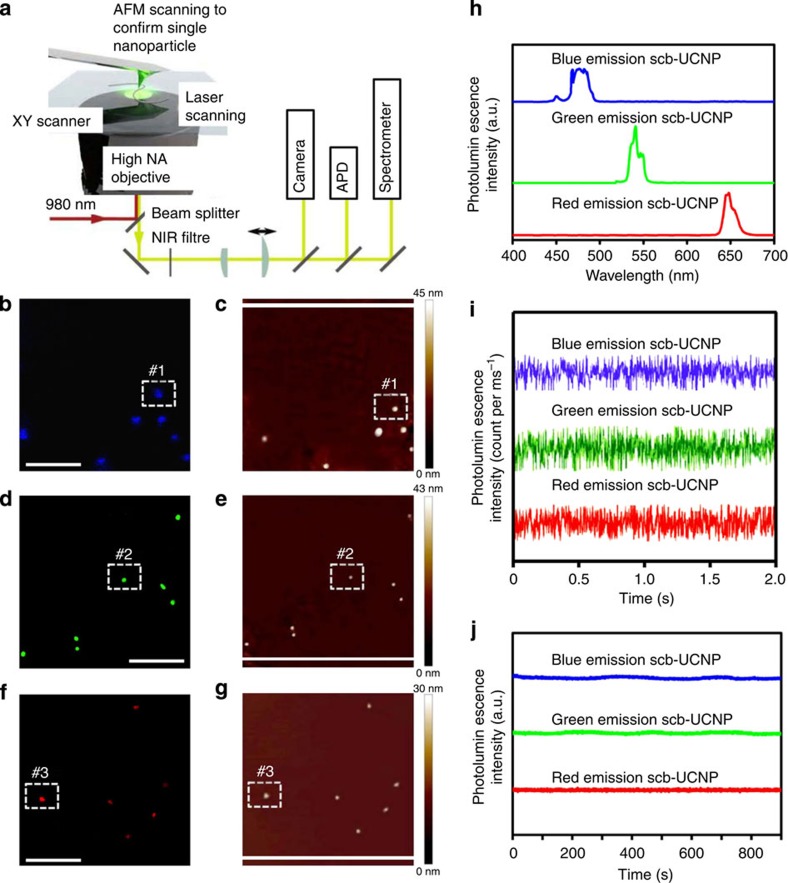
Figure 5. Single-particle optical property measurements of sb-UCNPs.
(a) Experimental setup. On top of an inverted microscope, an AFM allows direct size determination combined with optical characterization. Upconversion photoluminescence images (b,d,f) and AFM images (c,e,g) of blue (b,c), green (d,e) and red (f,g) emission sb-UCNPs dispersed on a poly(L-lysine)-coated coverslip. Both photoluminescence and AFM images were obtained for the same sample region, as indicated by the 1:1 correspondence of the particle locations. (h) Typical spectra of single sb-UCNPs #1, #2# and #3. Emission bands corresponding to the transitions 1G4→3H6 (∼480 nm), 4S3/2→4I15/2 (∼550 nm), and 4F9/2→4I15/2 (∼650 nm) can be observed. (i) The photoluminescence time traces for single nanoparticles #1, #2 and #3 acquired with 10-ms time bins. (j) Long-lifetime photoluminescence intensity traces for single nanoparticles #1, #2 and #3 acquired with 500-ms time bins. All optical data shown were obtained with continuous wavelength 980-nm laser excitation. Scale bar, 5 μm.

