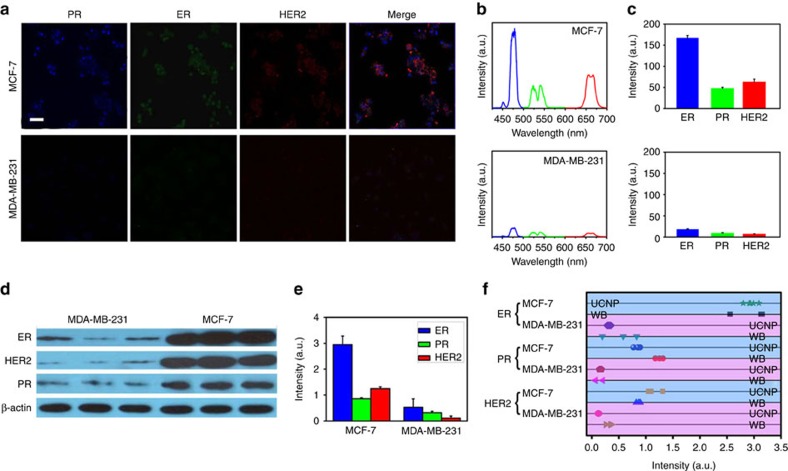
Figure 6. Multiplexed detection in breast cancer cell lines using sb-UCNPs.
(a) Expression of PR, ER and HER2 signals in MCF-7 and MDA-MB-231 breast cancer cells detected by fluorescence microscopy (pseudo-colour). (b) Representative spectra of the protein biomarkers obtained by single-cell spectroscopy measurements. (c) Average expression levels of ER, PR and HER2 determined by spectral analysis of 100 single cells. Data points represent mean+s.d. (n=100). (d,e) ER, PR, and HER2 expression in MCF-7 and MDA-MB-231 cells as measured by WB. Data points represent mean+s.d. (n=3). (f) Comparative statistical analysis of sb-UCNPs-Abs bioconjugate profiling data and WB results. Scale bar, 10 μm.

