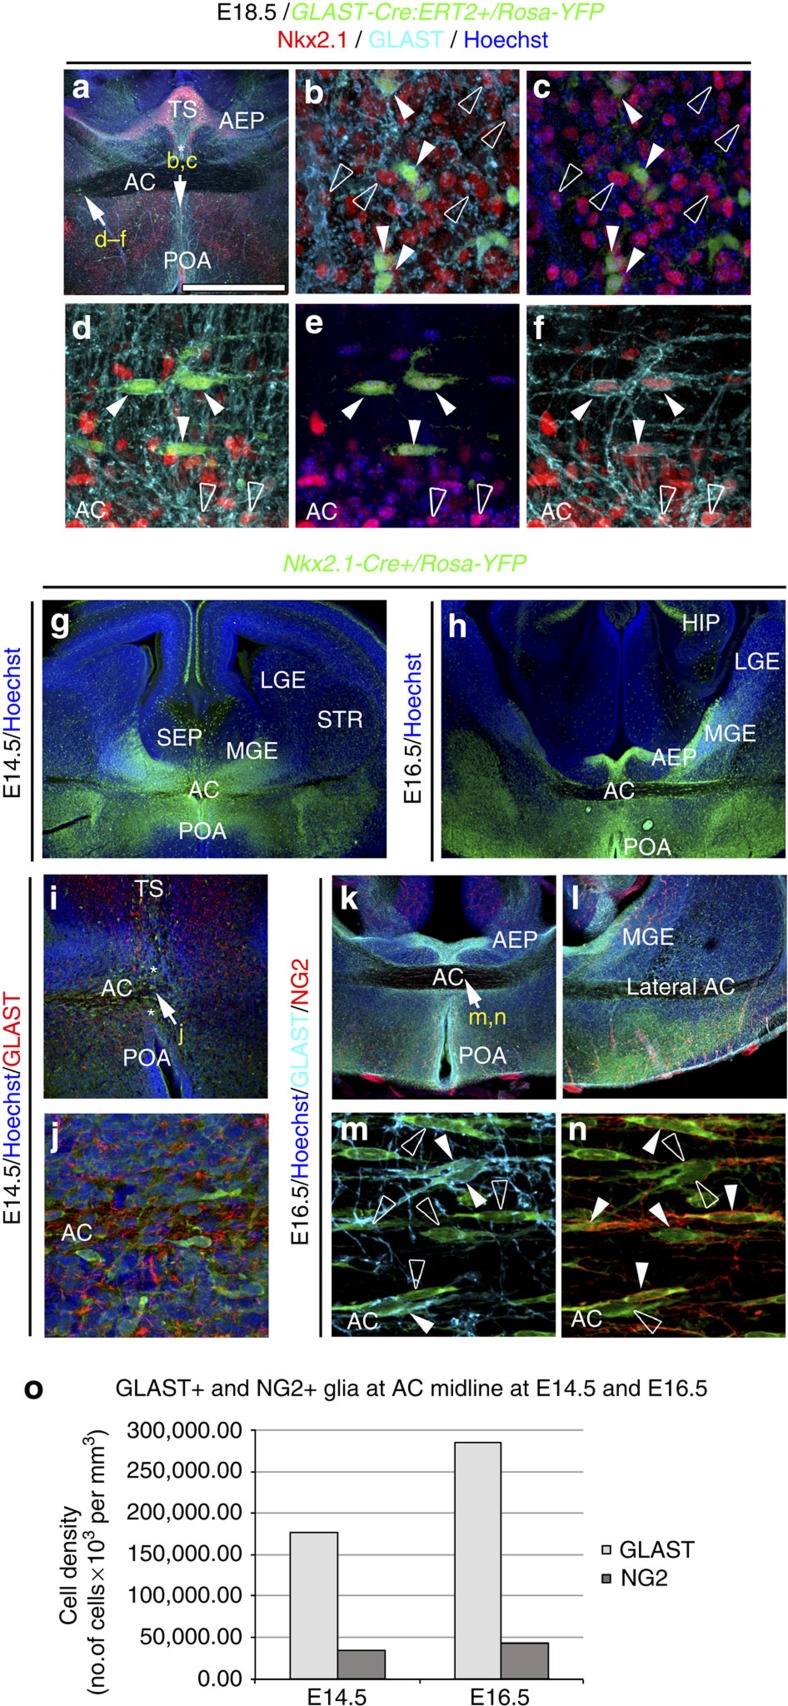
Figure 1. Presence of Nkx2.1-positive astrocytes in the AC during development.
(a) Triple immunohistochemistry for YFP (green), Nkx2.1 (red) and GLAST (blue) in coronal AC sections from GLAST-Cre:ERT2+/Rosa-YFP mice at E18.5 (n=3). (b–f) Higher power views of the AC regions pointed by arrows in a. The Cre-mediated recombination was initiated under the control of the inducible GLAST promoter at E15, and the GLAST-derived cells were visualized (green) with the YFP signal. YFP+/GLAST+ astrocytes of the AC co-expressed Nkx2.1 (solid arrowheads b–f). Some of the GLAST+/Nkx2.1+ glia were not labelled by the YFP signal and might have been generated before the recombination was induced (open arrowheads in b–f). (g–n) Immunohistochemistry for YFP (g,h), for YFP and GLAST (i,j) and for YFP, NG2 and GLAST (k–n) in coronal sections from Nkx2.1-Cre+/Rosa-YFP mice at E14.5 (n=3; g,i,j) and at E16.5 (n=8; h,k–n). (j,m,n) High-magnified views of the regions indicated by an arrow in i and k. (g–n) From E14.5 to E16.5, the Cre-mediated recombination induced under the control of the Nkx2.1 promoter (visualized in green by the YFP) is visible in GLAST+ astrocytes and NG2+ polydendrocytes at the AC midline. (k–n) Cre-mediated recombination occurred in both GLAST+ (light blue) and NG2+ (red) glial cells that constitute two mutually exclusive populations of glia. Cell nuclei were counterstained in blue with Hoechst (a,c,e,g–l). HIP, hippocampus. The scale bar shown in panel a corresponds to the following length for panel(s) specified in brackets: 1,375 μm (g); 675 μm (a,h,k,l); 320 μm (i); 60 μm (j); 50 μm (b,c) and 40 μm (d–f,m,n). (o) Quantification of the GLAST+ and NG2+glial cells in Nkx2.1-Cre+/Rosa-YFP mice at E14.5 and E16.5. Bars (mean from Nkx2.1-Cre−/Rosa-YFP brains at E14.5 (n=3) and E16.5 (n=8)) represent the cell densities of GLAST+ and NG2+ glial cells at the AC midline. After quantification, the densities of GLAST+ and NG2+ glia were not significantly increased from E14.5 to E16.5 (P>0.05, Student's t-test).

