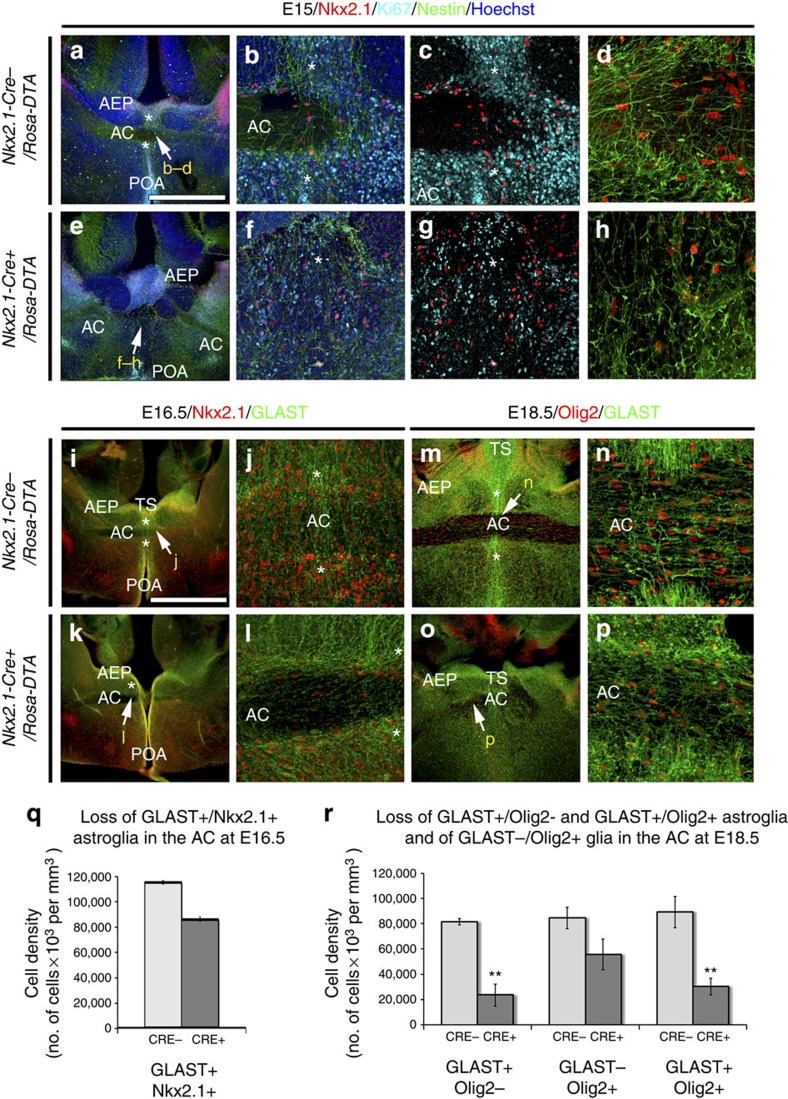
Figure 3. Post-mitotic glia of the AC are ablated in Nkx2.1-Cre+/Rosa-DTA brains.
(a–h) Triple immunochemistry for Nkx2.1, Ki67 and Nestin on E15 coronal slices from Nkx2.1-Cre−/Rosa-DTA (n=3; a–d) and Nkx2.1-Cre+/Rosa-DTA (n=3; e–h) mice. (i–p) Double immunochemistry for Nkx2.1 and GLAST on E16.5 (i–l) and for Olig2 and GLAST on E18.5 (m–p) coronal slices from Nkx2.1-Cre−/Rosa-DTA (i,j,m,n) and Nkx2.1-Cre+/Rosa-DTA (k,l,o,p) mice. (b–d,f–h,j,l,n,p) High-magnified views of the regions indicated by an arrow in a,e,i,k,m and o. (a–l) The GLAST+/Nestin+/Nkx2.1+/Ki67− post-mitotic tunnel astroglia forming a palisade (*) surrounding the AC are depleted in the Nkx2.1-Cre+/Rosa-DTA (e–h,k,l) compared with control (a–d,i,j) mice. (m,n) In control mice, numerous GLAST+/Olig2−, GLAST−/Olig2+ and GLAST+/Olig2+ glial cells are observed within and around the AC. (o,p) In Nkx2.1-Cre+/Rosa-DTA mice, the number of AC GLAST+/Olig2−, GLAST−/Olig2+ and GLAST+/Olig2+ is decreased after cell ablation. Cell nuclei were counterstained in blue with Hoechst (a,b,e,f). The scale bar shown in panel a corresponds to the following length for panel(s) specified in brackets: 675 μm in a,e,i,k,m,o; 160 μm (b,c,f,g,j,l,n,p); 50 μm (d,h). (q) Bars (means±s.e.m.) from Nkx2.1-Cre−/Rosa-DTA (n=5) and Nkx2.1-Cre+/Rosa-DTA (n=3) brains represent the cell densities of GLAST+/Nkx2.1+ at the AC midline at E16.5. After quantification, the density of GLAST+ astrocytes expressing Nkx2.1 was decreased in Nkx2.1-Cre+/Rosa-DTA mice compared with control mice. (r) Bars (means±s.e.m.) from Nkx2.1-Cre−/Rosa-DTA (n=5) and Nkx2.1-Cre+/Rosa-DTA (n=5) brains represent the cell densities of GLAST+/Olig2−, GLAST−/Olig2+ and GLAST+/Olig2+ glial cells at the AC midline at E18.5. After quantification, the density of GLAST+ astrocytes expressing or not Olig2 was significantly decreased in Nkx2.1-Cre+/Rosa-DTA mice compared with control mice (**P<0.01, n=5, Student's t-test).

