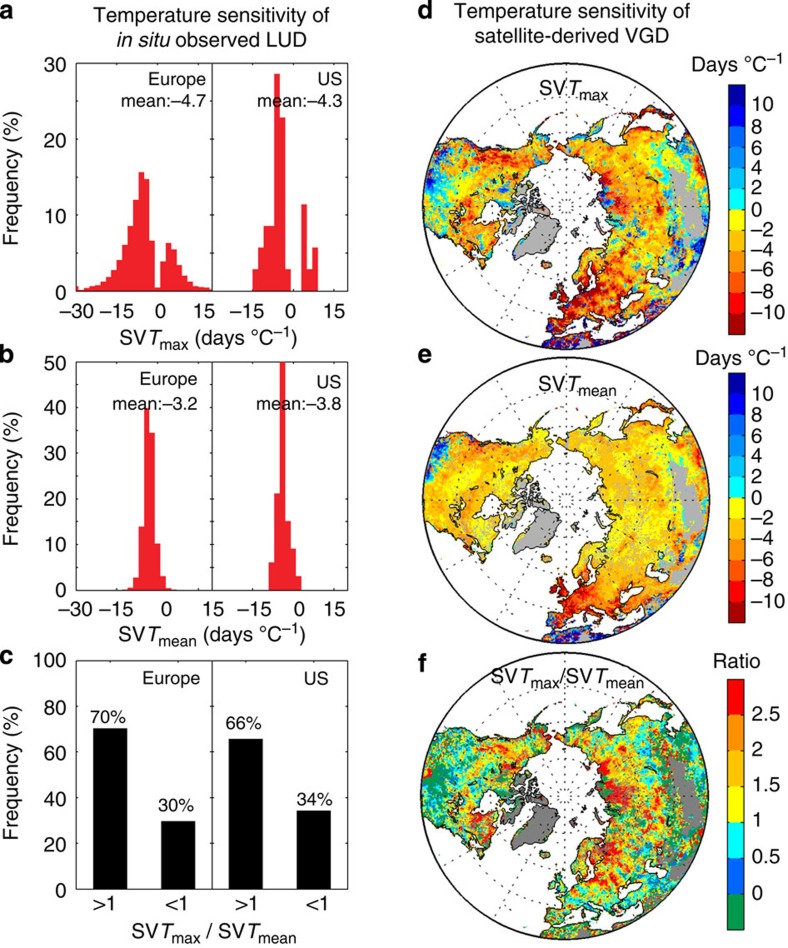
Figure 3. The sensitivity of LUD and VGD to Tmax and Tmean during 1982–2011.
The frequency distributions of the temperature sensitivity of LUD to (a) Tmax (SVTmax) and (b) Tmean (SVTmean) and (c) the ratio between SVTmax and SVTmean (SVTmax/SVTmean) in Europe and the United States. In the right panel of figure, the spatial distributions of the sensitivity of VGD are shown (d) Tmax (SVTmax) and (e) Tmean (SVTmean) and (f) the ratio between SVTmax and SVTmean (SVTmax/SVTmean) in the northern hemisphere during 1982–2011.

