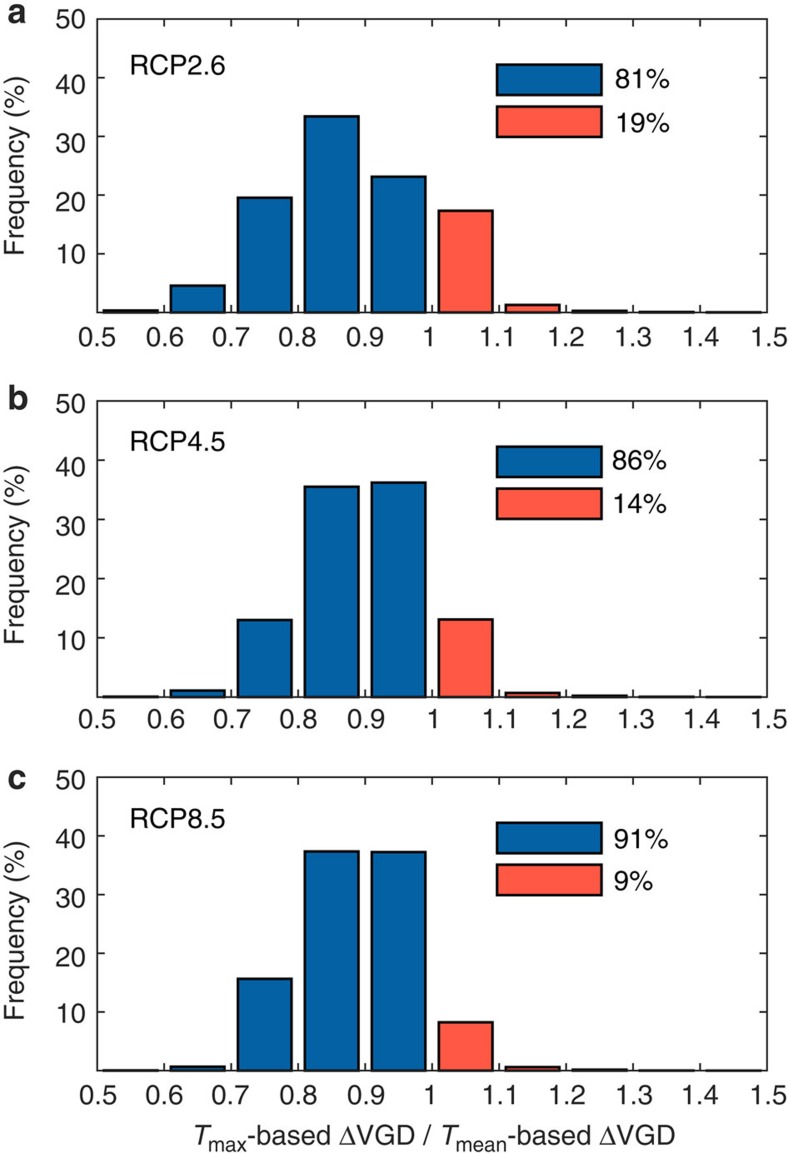
Figure 4. The ratios of future VGD changes predicted by a Tmax-based GDD concept model to that predicted by a Tmean-based GDD concept model.
Both Tmean-based GDD approaches and Tmax-based GDD models were applied to predict the VGD changes (▵VGD) between 1991–2010 and 2081–2100, using 24 climate models and different climate change scenarios (RCP2.6, RCP4.5 and RCP8.5). For each RCP, the Tmax-based predictions and the Tmean-based predictions were averaged across all models and the distributions of their ratio (Tmax-based predictions/Tmean-based predictions) are shown in (a), (b) and (c). The ratio <1 (blue bar) represents that the future VGD changes predicted by Tmean-based approaches are larger than those predicted by Tmax-based approaches and vice versa (red bar). The percentage of ratios <1 and the percentage of ratios >1 are both provided in a,b and c.

