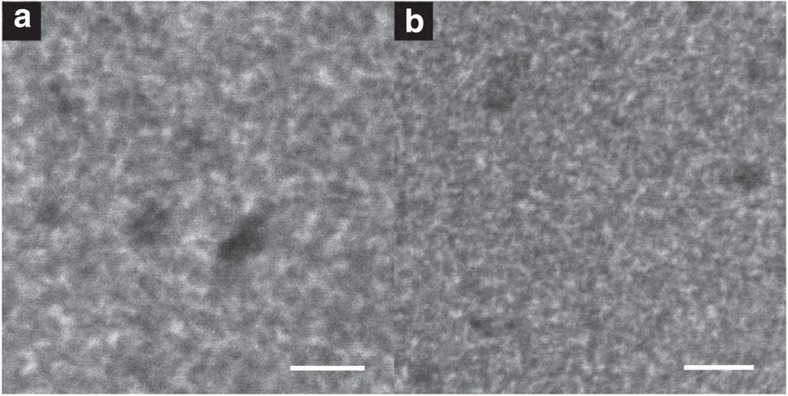
Figure 3. Overview of EFSEM results for P3HT:PCBM (1:0.8 wt%) blend.
(a) Higher-magnification image (scale bar, 20 nm). (b) Lower-magnification image (scale bar, 30 nm). Spectroscopy of blend components suggests that brighter regions are P3HT-rich, darker are PCBM-rich. Clear mixed-phase regions are also visible.

