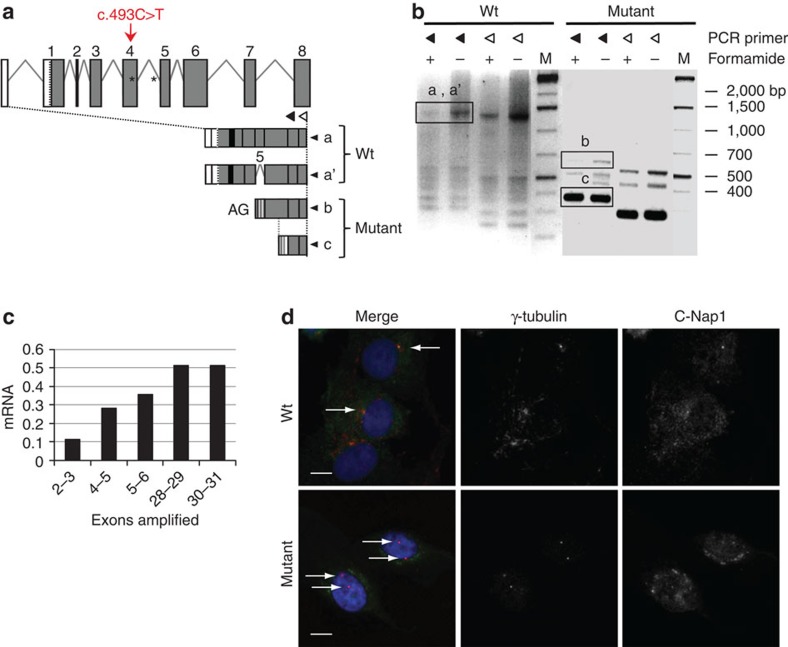
Figure 2. Characterization of truncated CEP250 transcripts and C-Nap1 mislocalization in SHGC primary fibroblasts.
(a) Structure of the 5′ region of the bovine CEP250 gene. The 5′ untranslated region is depicted in white. Exons are numbered from the first coding exon. Two transcripts (a and a′) are detected in wild-type cells including one lacking exon 3 and retaining the last five nucleotides of intron 3 (a′). Mutation in exon 4 generates two shorter transcripts: transcript (b) starts at an AG dinucleotide likely located at the end of intron 4 and includes exon 5 (depicted as *); transcript (c) starts in exon 6 at nucleotide 656 of the open reading frame. (b) Agarose gel showing the 5′ RACE products amplified using RT primer GSP1 and GSP2 located in exon 9 and PCR primers GSP3 or GSP4 located in exon 8 (black and white triangles, respectively), with or without formamide. The longest products were purified and sequenced (boxes). Original gel is presented in Supplementary Fig. 6. (c) Relative CEP250 mRNA levels estimated by RT–qPCR targeting the indicated exons. Values are provided relative to wild type. Mutant, n=3 and wild-type, n=2. (d) C-Nap1 subcellular localization in wild-type and SHGC mutant fibroblasts using C-Nap1 C-terminus labelling (R63 serum). In 92% of wild-type cells (n=113), centrosomes (white arrows) are labelled with an antibody against γ-tubulin (red) and with R63 (green). In 91% of mutant cells (n=97), only γ-tubulin labelling is detected on split centrosomes (double arrows). The anti-C-Nap1 antibody only produced a heterogeneous labelling (green colour on the merge) but no labelling of split centrosomes. Scale bar, 10 μm.

