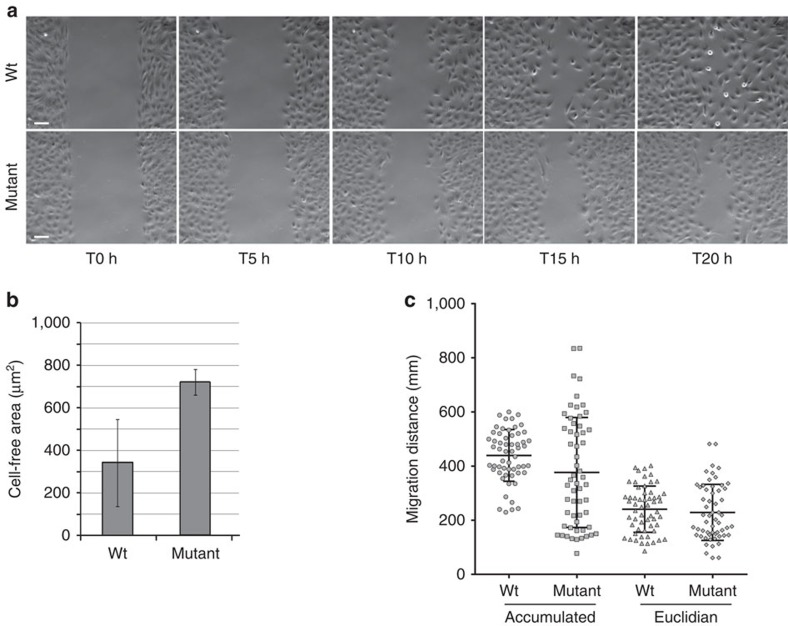
Figure 6. Altered migration behaviour in SHGC mutant fibroblasts.
(a) Phase contrast images from time-lapse video-microscopy showing the migration capacity of cells in a wound-healing assay. Wild-type and SHGC mutant confluent quiescent cells migrated into the cell free gap of 500 μm during 20 h. Scale bar, 100 μm. (b) The cell-free area was measured at 20 h. Data show the mean and standard deviation from four independent experiments with one animal of each genotype. A Student's t-test following two-tailed analysis of variance using the Prism software was run to calculate P values (**P=0.008). (c) The migration tracks of wild-type and SHGC mutant cells were plotted in ImageJ (manual tracking plugin) and data analysed after normalizing each starting point to x=0 and y=0 (Ibidi software). The accumulated and Euclidean distance covered by individual cells, as well as the mean, upper and lower decile of the directionality distribution from four individual experiments of two wild-type and two mutant SHGC cell cultures are shown. Wild-type cells, n=73. SHGC mutant cells, n=52. A Student's t-test following two-tailed analysis of variance using the Prism software was run to calculate P values (****P<0.0001). The greater the directionality, the more linear the motion in a given direction is.

