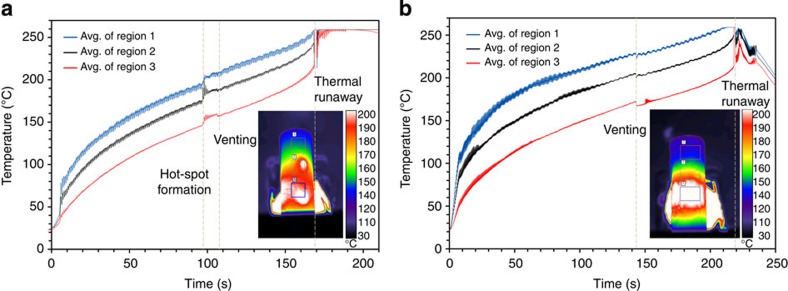
Figure 2. Temperature measurement.
(a) Mean surface temperature profiles of the three regions (shown in the thermal image) on Cell 1 during the thermal abuse test showing thermal runaway after 168 s. The hotspots shown in the thermal image occurred on the surface of the shell after 97 s in Supplementary Movie 1. As judged from the thermal image, the spot size of the heat gun on the surface of the cells was ca. 10 mm in diameter. (b) Mean surface temperature profiles of the three regions on Cell 2 during the thermal abuse test showing thermal runaway after 217 s. The thermal image was extracted from Supplementary Movie 2 after 80 s of heating.

