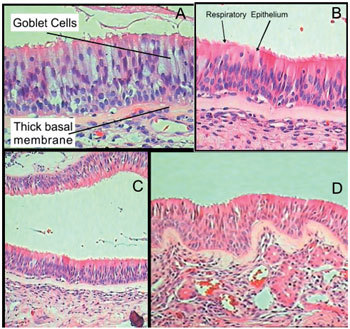
Figures 3A, 3B, 3C, 3D.

Scatter plots of the correlations between the presence of ON and age of the cadaver at the time of death. 6A: Posterior half of the superior turbinate; 6B: Anterior half of the superior turbinate; 6C: Posterior half of the middle turbinate; 6D: Anterior half of the middle turbinate.
