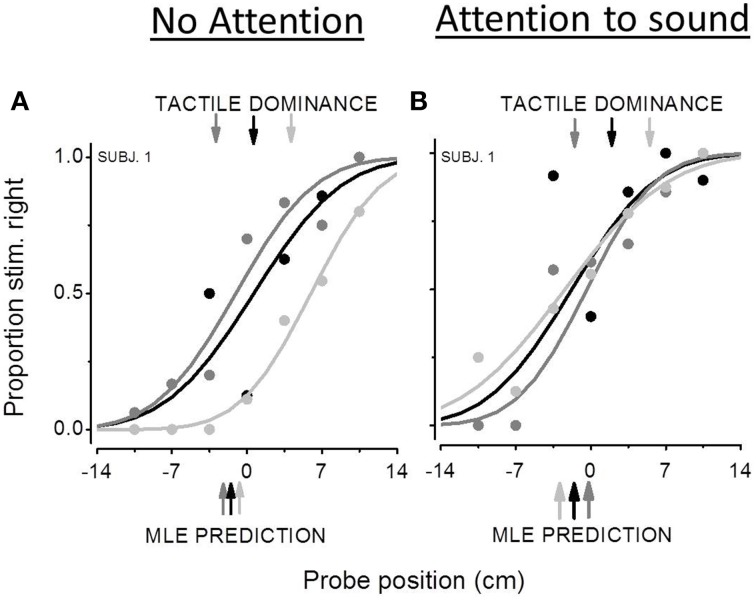
Figure 3.
Bimodal psychometric functions from the same participant in the non attentional condition (A) and in the attentional condition (B). The black curve represents subject's performance in the Δ = 0 audio-tactile conflict, the dark gray curve the performance in the Δ = −7 conflict and the light gray curve the Δ = +7 conflict. The x-axis represents the estimated position of the second stimulus by the QUEST algorithm (cm). Positive values of PSE mean a spatial bias to the left, while negative values a bias to the right. The lower color-coded arrows show the MLE prediction. The upper color-coded arrows indicate the predicted PSEs in the case of tactile dominance.

