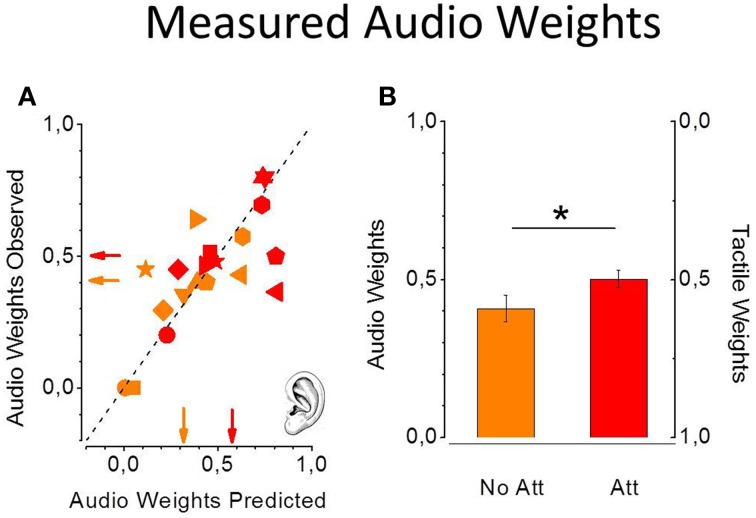
Figure 5.
Predicted and observed individual auditory weights from the 10 participants in the non-attentional (light red) and the attentional (dark red) condition (A). Standard errors were computed with bootstrap simulation. Data are all scattered on the equality line meaning perfect prediction from the MLE model. Measured average auditory weights are higher in the attentional condition (B). (*p < 0.05).

