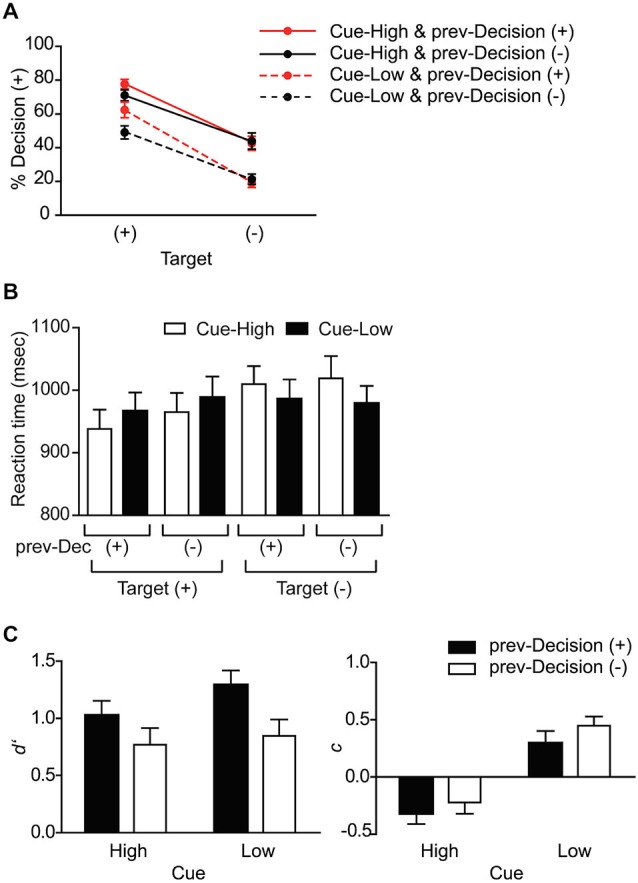
Figure 2.

Behavioral data. (A) Probability of making a target-present decision (% Decision (+)). The data are shown separately for Target (+) and (−) trials, and for each Cue and prev-Decision type. Mean and SE across subjects (n = 16). (B) Reaction time. The data are shown separately for the eight conditions based on Cue, Target, and prev-Decision (prev-Dec) type. Mean and SE across subjects (n = 16). (C) Sensitivity index d′ and criterion index c. The data are shown separately for the four conditions based on Cue and prev-Decision types. Mean and SE across subjects (n = 16).
