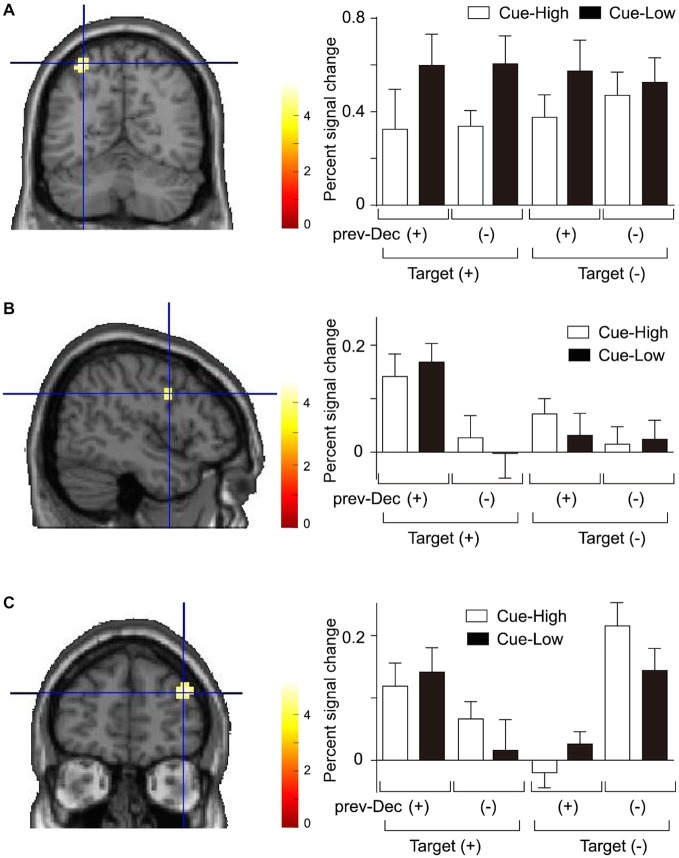
Figure 3.
Activation during presentation of the Gabor stimulus. (A) Activation in the left intraparietal sulcus (IPS) showing a significant main effect of Cue. Left: The mean activation of the group-mean-peak-voxel is indicated by a cross-hair (MNI coordinate: −33, −61, 58). Right: The percent signal change is plotted for each Cue, Target, and prev-Decision (prev-Dec) type. Mean and SE across subjects (n = 16). (B) Activation in the right inferior frontal gyrus (IFG) (peak MNI coordinate: 48, 2, 28) showing a significant main effect of prev-Decision. The format is the same as (A). (C) Activation in the right middle frontal gyrus (MFG) (peak MNI coordinate: 39, 50, 25) showing a significant interaction between prev-Decision and Target. The format is the same as (A).

