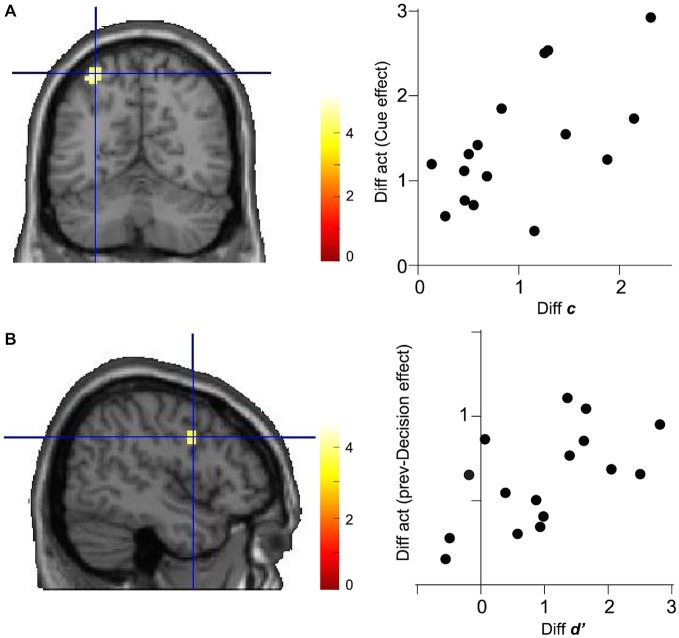
Figure 4.
Correlations between decision parameter and brain activation. (A) Differential activation (Diff act) in the left IPS (MNI coordinate: −33, −61, 58) between Cue-Low and Cue-High trials is plotted against the differential decision criteria (Diff c). Data are shown for 16 subjects. (B) Differential activation in the right IFG (MNI coordinate: 48, 2, 28) between prev-Decision (+) and prev-Decision (−) trials is plotted against the difference in decision sensitivity (Diff d′).

