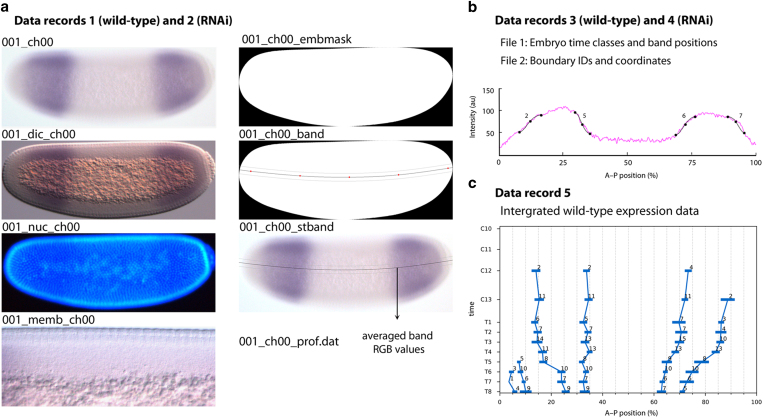
Figure 1. Overview of data records presented in this paper.
(a) Data Records 1 (wild-type) and 2 (RNAi). These data records include cropped and rotated images of gap gene expression taken using bright field and differential interference contrast optics (ch00 and dic_ch00 suffixes respectively), an image of the nuclear counterstain (nuc_ch00) and an unprocessed image of the dorsal membrane morphology (memb_ch00). These data records also include embryo masks (embmask) and images of the band location superimposed onto the embryo mask (band) and brightfield (stband) images. The file 001_ch00_prof.dat contains averaged band RGB values seen plotted in magenta in (b). (b) Data Records 3 (wild-type) and 4 (RNAi): these records are composed of two CSV files that document the time class and position of the 10% strip used for profile extraction for each embryo (File 1), plus the associated boundary IDs and coordinates (File 2). The graph shows an example, where splines fit to boundaries 2, 5, 6 and 7 of gt are plotted against the extracted profile (magenta; see Fig. 2 for boundary numbers). Images in (a) and (b) correspond to embryo 001 that can be found in Data Record 1 in ish/megaselia/ma_gt_260911/proc. (c) Data Record 5. This data record is composed of a CSV file containing averaged coordinates and standard deviations of expression boundaries for each gene. Embryos are oriented with anterior to the left, dorsal up.

