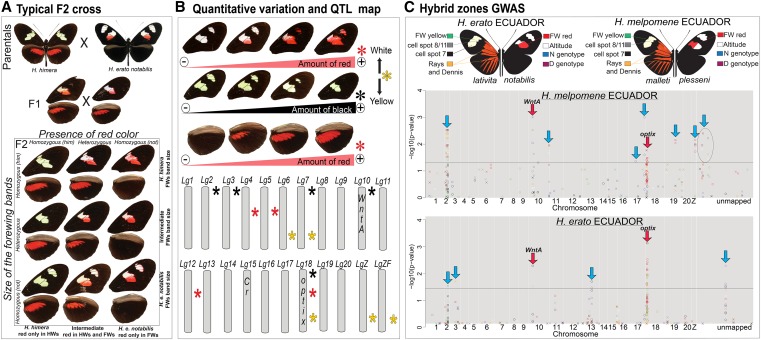
Figure 3.
Mapping color-pattern variation in Heliconius: Mendelian segregation, quantitative variation, and genome-wide association. (A) An F2 mapping family from a cross between sister species H. himera and H. erato notabilis shows Mendelian segregation of black (Sd = WntA) and red (D = optix) wing-scale distributions (Papa et al. 2013). (B) Quantitative wing-color variation and linkage group distribution of QTL for black, red, and yellow/white color-pattern variation (stars) in the same mapping family. Stars indicate the presence of at least one locus modulating black (black star), red (red star), or yellow/white (yellow star) pattern variation. (C) Genome-wide association study of wing-color-pattern variation in H. melpomene and H. erato Ecuadorian hybrid zones (Nadeau et al. 2014). The different colors of points represent individual SNPs associated with distinct pattern elements shown in the wing images above. Points above the lines represent significant associations. Red arrows indicate the positions of optix (D locus) and WntA (Sd locus). Blue arrows indicate the positions of putatively undescribed color-pattern loci, many of which are not shared between H. melpomene and H. erato.

