Figure 2.
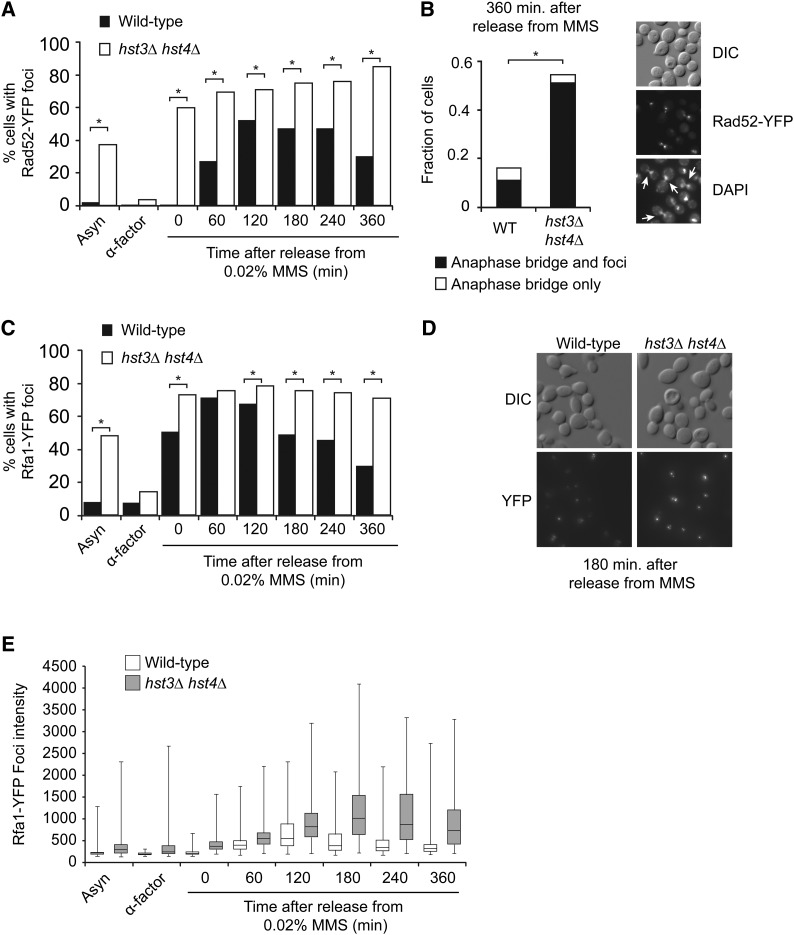
hst3∆ hst4∆ cells present abnormal frequencies of spontaneous and MMS-induced Rad52 and Rfa1 foci. (A) Formation of persistent Rad52-YFP foci in hst3∆ hst4∆ mutants transiently exposed to MMS during S phase. Cells were synchronized in G1 and released toward S phase in the presence of 0.02% MMS for 90 min at 25°. MMS was inactivated using sodium thiosulfate–containing medium, and cells were incubated in fresh medium without MMS. Samples were taken at the indicated time points, and Rad52-YFP foci were detected by fluorescence microscopy. At least 300 cells were analyzed for each time point; results from a representative experiment are shown. *P-value < 0.0001; χ2 test. (B) hst3∆ hst4∆ mutants display anaphase bridges after transient exposure to MMS during S phase. Images of DAPI staining and Rad52-YFP foci from the “360 min” sample in A were analyzed for the presence of anaphase bridges. (Left panel) Fraction of cells containing anaphase bridge with or without Rad52-YFP foci. (Right panel) Representative image of anaphase bridges (indicated by arrows). More than 350 cells were analyzed. *P-value < 0.0001; χ2 test. (C and D) Transient MMS exposure during S phase causes the formation of persistent Rfa1-YFP foci in hst3∆ hst4∆ mutants. (C) Cells were treated as in A, except that samples were analyzed for the presence of Rfa1-YFP foci by fluorescence microscopy. A representative experiment is shown. More than 300 cells were analyzed for each time point. *P-value < 0.0001; Fisher’s exact test. (D) Representative images of the “180 min” time point from C. (E) The intensity of Rfa1-YFP foci was analyzed using a custom-made software (see Materials and Methods for details). Whiskers of the box-and-whiskers plot represent the first and fourth quartiles of the distribution. Statistical analysis of these data are presented in Table 2.

