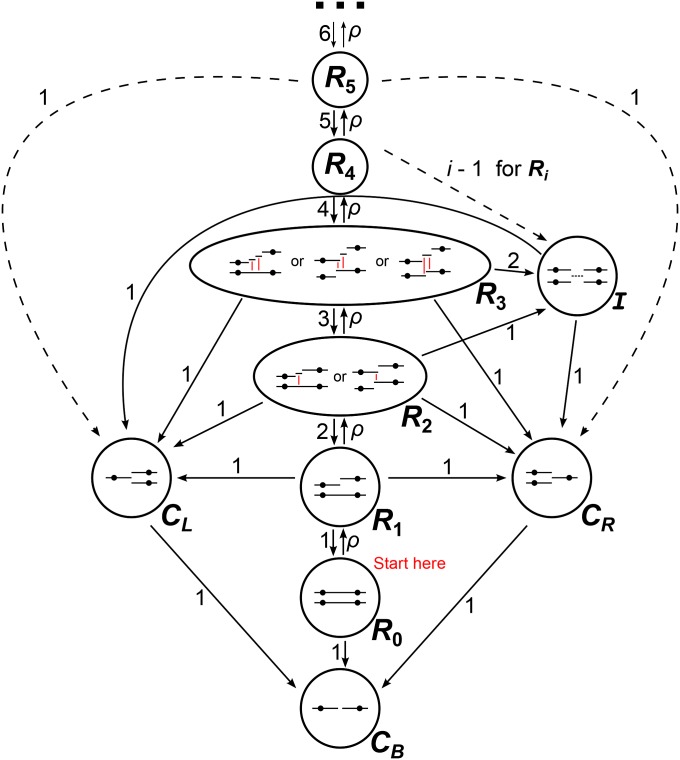
Figure 3.
Schematic of the SMC′ back-in-time Markov process for two loci. Dashed arrows show transition rates that apply for all Ri. State I is the state in which some portion of the chromosome between the two focal loci has coalesced but neither focal locus has coalesced. The red lines in states R2 and R3 show the coalescence events that take the process to state I.

