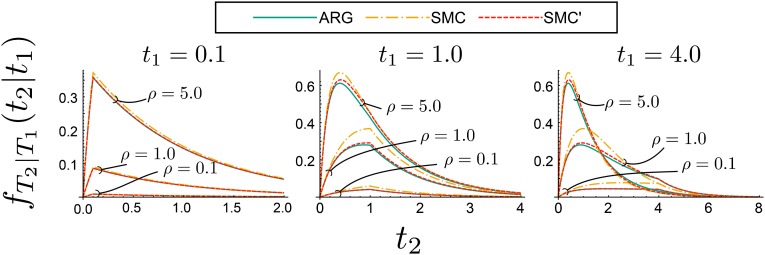
Figure 6.
Comparison of densities of coalescence times at the right locus conditioned upon coalescence times at the left locus. Conditional densities are shown for the ARG, SMC, and SMC′ models for three different rates of recombination between the two loci () and three different conditioned-upon coalescence times at the left locus (). The area under each curve is ; the conditional probabilities are not shown.

