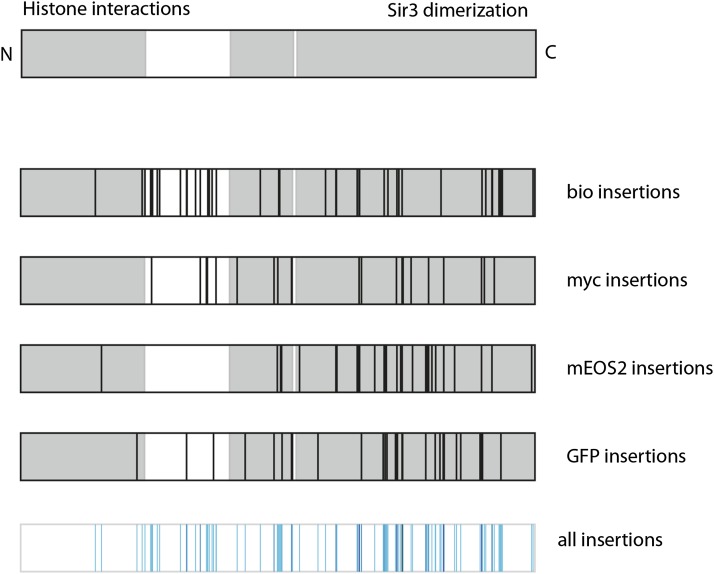
Figure 6.
Distribution of functional tagged alleles of C. glabrata SIR3. (Top) Linear representation of the C. glabrata Sir3 protein (1088 residues). The gray areas are predicted globular domains (by ELM), which have been found to have roles in associating with histones (N-terminal domain) and Sir3 dimerization (C-terminal domain). In the schematics below, a black line is located at the position for each unique insertion site identified from among the functional Sir3-bio, Sir3-myc, Sir3-mEOS2, and Sir3-GFP pools. (Bottom) Schematic overlays all sites at which a functional tagged Sir3 was identified. The color of the line indicates the number of mutagenesis pools in which the particular insertion site was identified; light blue indicates that the site was identified in only one pool; black indicates that it was found in all four mutagenesis pools.

