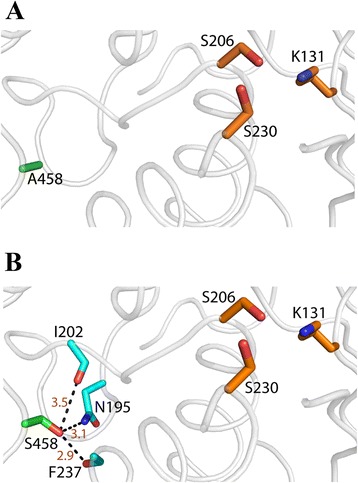
Figure 3.

Modeled structural environments of the disease-causing mutations in FAAH2. Modeled structure of human FAAH2. The protein backbone is shown as a cartoon (white) with the side chains of A458 (green) and the catalytic triad residues (K131, S206, S230; orange) shown as sticks. (B) Additional interactions formed by the p.Ala458Ser mutation. Potential hydrogen bonds are observed between the side chain of Ser458 (green sticks) and the side chain of N195 or the carbonyl oxygens of I202 and F237 (cyan sticks). Distances in angstroms between interacting atoms are shown in dark red.
