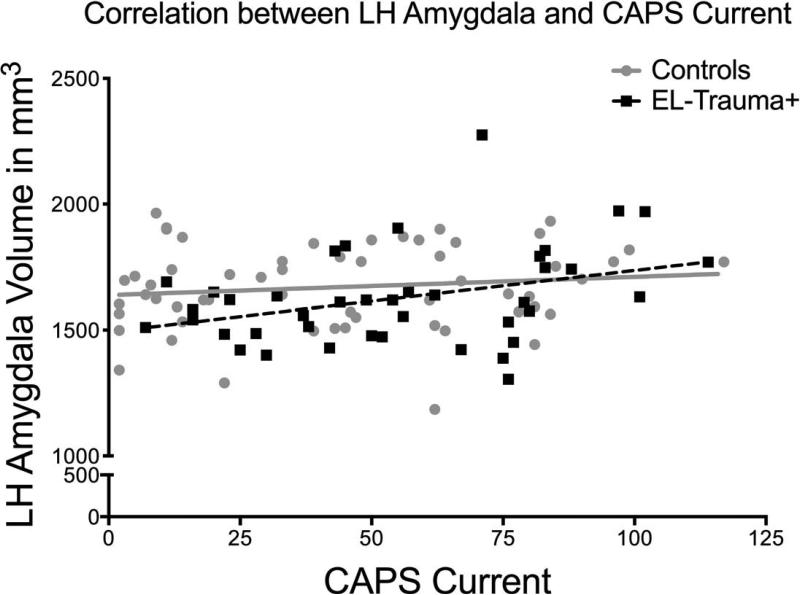
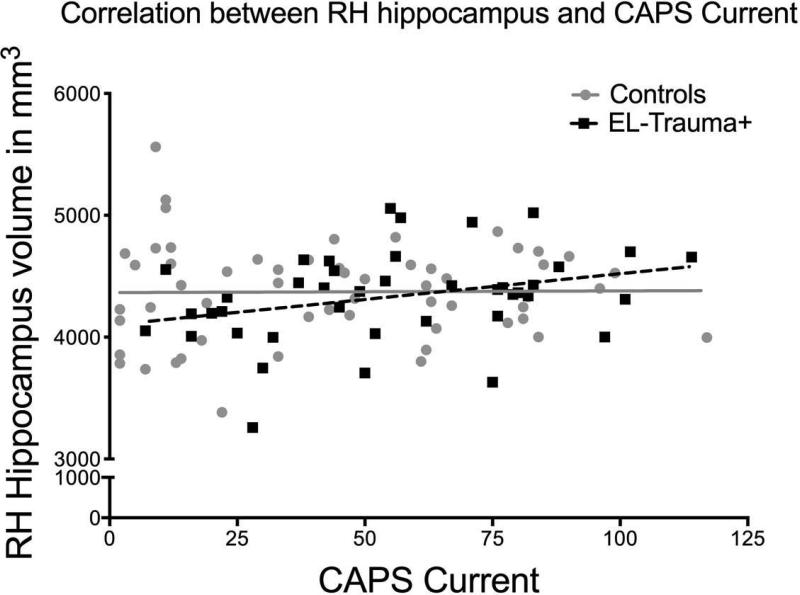
Fig. 3.
a (top) and 3b (bottom). Exploratory analyses revealed that correlations in the EL-Trauma+ group only showed associations between the severity of current PTSD symptoms and the volume of the left amygdala (top panel; r (42)= 0.364, P < 0.02) and right hippocampus (bottom panel; r (42)= 0.310, P < 0.05). The EL-Trauma+ group is represented by squares and dashed line, while the Control group is represented by circles and full line.


