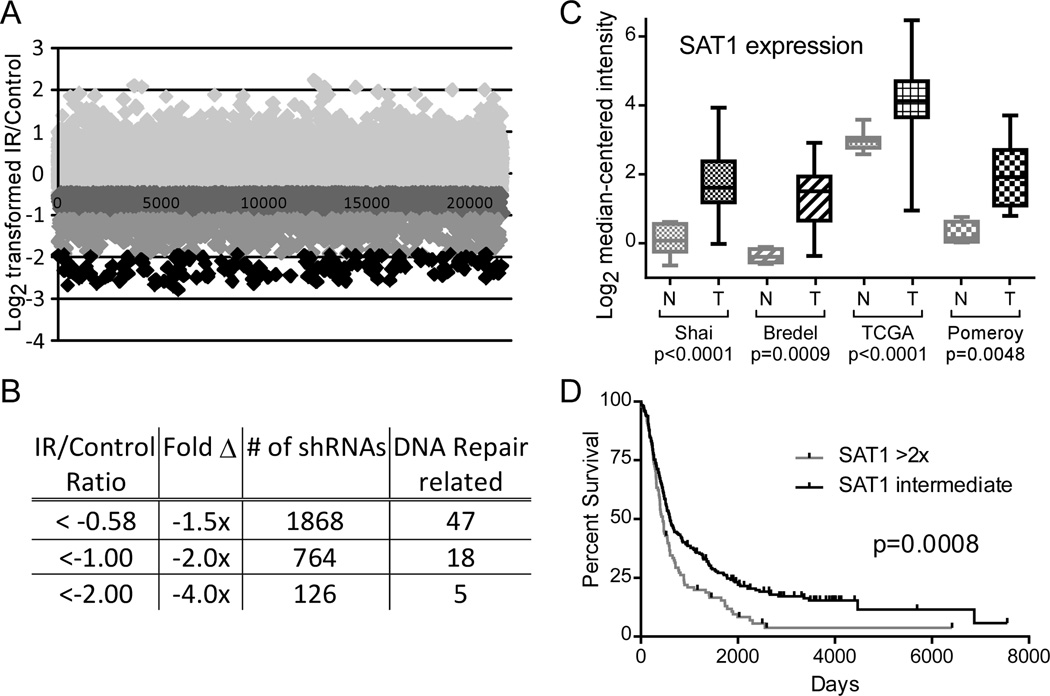
Figure 1. Relevance of SAT1 to GBM.
A. Raw data of the U87MG shRNA screen; abundance of individual barcodes represented as Log2 transformed ratios of irradiated over non-irradiated cells, shaded by level of depletion. B. Quantification of barcode abundance ratios. 1,868 barcodes decreased ≥1.5-fold; 764 decreased ≥2-fold; and 126 decreased ≥4-fold. C. Oncomine data of SAT1 expression in brain tumors (N=normal, T=tumor). D. Rembrandt survival curves of glioma patients with high SAT1 versus low SAT1 expressing tumors.

