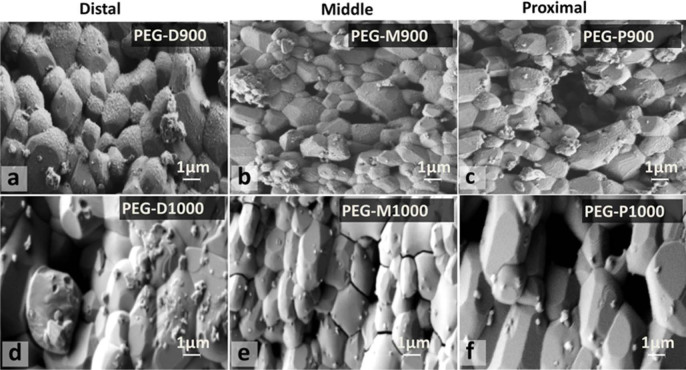
Figure 5. Surface morphology of PEG-treated BA scaffolds (a – PEG-D900, b – PEG-M900, c – PEG-P900, d – PEG-D1000, e – PEG-M1000, and f – PEG-P1000) after degradation test for day-7 at 37°C in PBS.
Presence of PEG in a–c compared to d–f, but size of deposited particles is large in d–f compared to a–c. PEG impregnated sintered bovine scaffolds on Days 1, 4, and 7.

