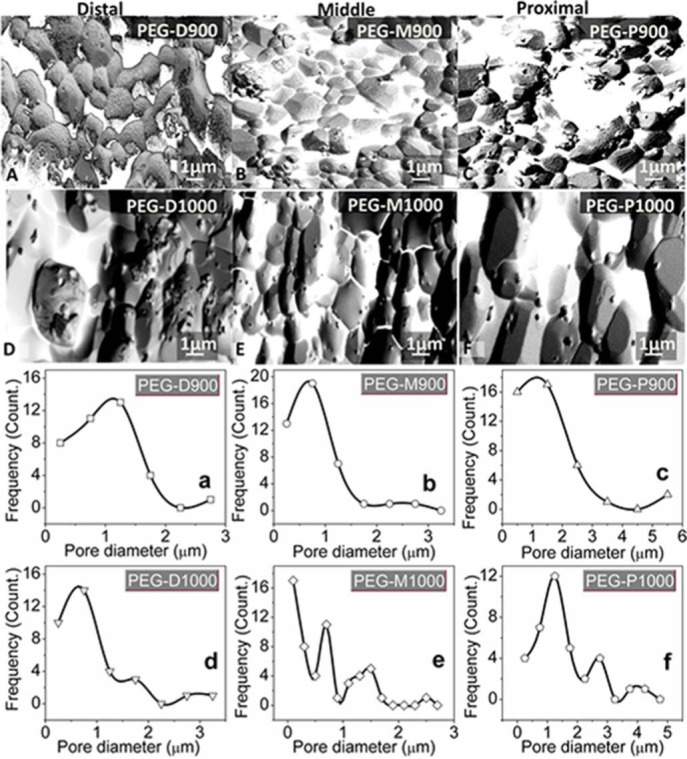
Figure 6. Inverted SEM images of PEG treated BA scaffolds (A – PEG-D900, B – PEG-M900, C – PEG-P900, D – PEG-D1000, E – PEG-M1000, and F– PEG-P1000) after degradation test for day-7 at 37°C in PBS.

Pore size distribution of these scaffolds using image J software are for (a) PEG-D900, (b) PEG-M900, (c) PEG-P900, (d) PEG-D1000, (e) PEG-M1000, and (f) PEG-P1000, respectively. Note: single mode pores are present in the PEG-treated scaffolds sintered at 900°C and multimode pores at 1000°C. Scaffolds from proximal part have wide range of pore size compared to distal or middle part of the bovine femur.
