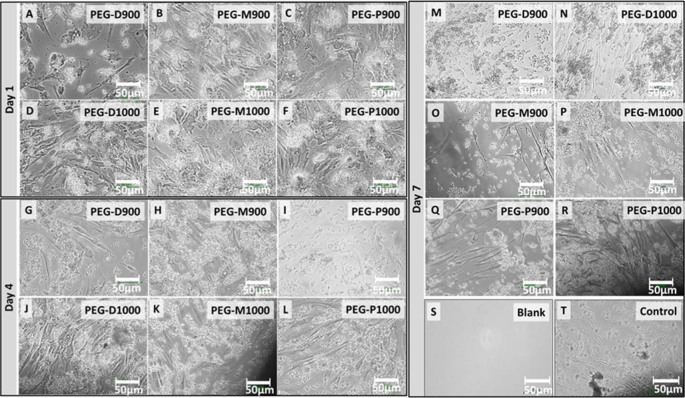
Figure 9. Optical micrographs of the live fibroblast cells at wells adjacent to the PEG-impregnated BA scaffolds sintered at 900 and 1000°C derived from the three different femoral sections at day-1 (A – PEG-D900, B – PEG-M900, C – PEG-P900, D – PEG-D1000, E – PEG-M1000, and F – PEG-D1000), day-4 (G – PEG-D900, H – PEG-M900, I – PEG-P900, J – PEG-D1000, K – PEG-M1000, and L – PEG-D1000), and day-7 (M – PEG-D900, N – PEG-D1000, O – PEG-M900, P – PEG-M1000, Q – PEG-P900, and R – PEG-P1000) just before the AB assay.
Images of (S) negative control or blank (only medium in well, without cell and scaffold) and (T) positive control (only medium and cells in well, without scaffold) wells after day 7 are presented for comparison. All the scale bars are 50 µm. Amount of live cell concentration is higher in the wells for the PEG-treated scaffolds sintered at 1000°C compared to 900°C.

