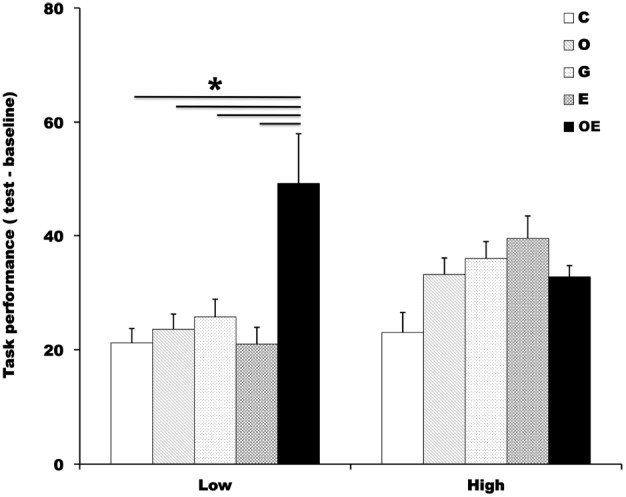
FIGURE 3.

Participants were divided into a high-score group and a low-score group on the basis of the median value in the addition task in baseline. The graph shows the average number of values participants calculated during the addition task in the baseline phase and test phase. Error bars indicate the standard error of the mean in each condition. C, control condition; O, observed condition; G, greeting condition; E, exercise condition; OE, observed-with-exercise condition.*p < 0.05.
