
FIGURE 4.
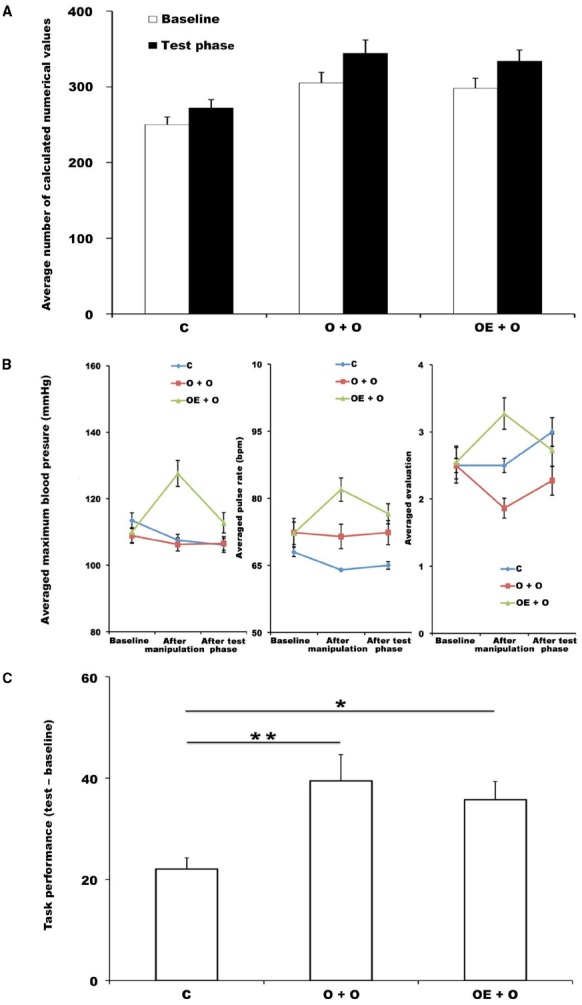
(A) Average number of values participants calculated during the addition task in the baseline phase and test phase. Error bars indicate the standard error of the mean in each condition. C, control condition (main experiment); O + O, observed + observed at test condition (supplementary experiment); OE + O, observed-with-exercise + observed at test condition (supplementary experiment). *p < 0.05. (B) Mean values of SBP, HR and self-reports at the baseline, after manipulation, and after test phase. Error bars indicate the standard error of the mean in each condition. (C) Averaged differences in single-digit addition task performance between the baseline results and the test session in each condition. Error bars indicate the standard error of the mean in each condition. C, control condition (main experiment); O + O, observed + observed at test condition (supplementary experiment); OE + O, observed-with-exercise + observed at test condition (supplementary experiment).*p < 0.05; ** p < 0.01.