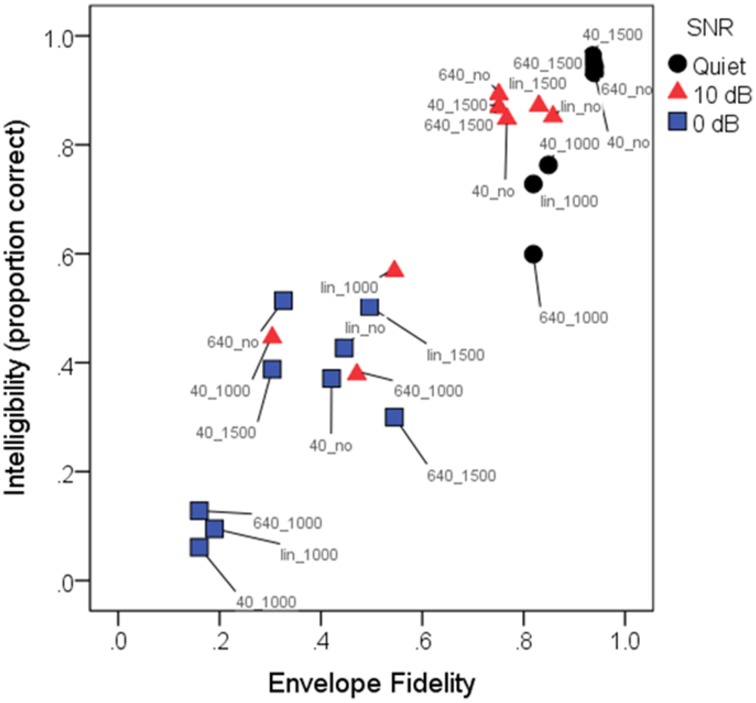
Figure 5.
Mean intelligibility scores (in proportion correct) as a function of envelope fidelity. For linearity prior to analysis, the envelope distortion metric was subjected to a sigmoidal transformation. Pearson product-moment correlation was 0.93, indicating that the envelope fidelity metric was a good predictor of intelligibility scores. Each condition is indicated by a color-label combination. Symbols indicate the three SNRs: quiet (black circles); 10 dB SNR (red triangles); 0 dB (blue squares). Labels indicate the conditions, where 40_, 640_, and lin_ represent WDRC release time or linear amplification, and _1000, _1500, or _no represent frequency compression cutoff frequency or no FC. As quantified by the envelope fidelity metric, the highest-fidelity condition was linear amplification without frequency compression for speech in quiet, and the lowest-fidelity condition was speech at a signal-to-noise ratio of 0 dB with a compression release time of 40 ms and a frequency compression cutoff of 1000 Hz. Note that due to the close clustering of symbols with high (near-100%) intelligibility, not all symbols and labels are visible in the figure.

