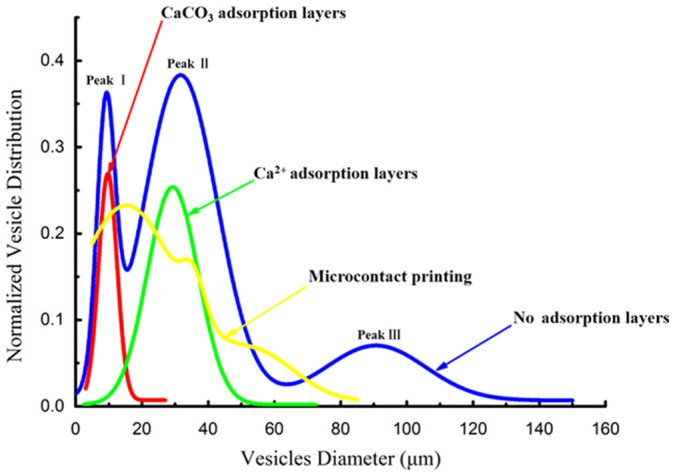
Figure 2. The comparision of size distributions for GUVs prepared by four methods based on different models.

Red curve: the model of the minerals adsorption layer; green curve: the model of the ions adsorption layer; deep blue curve: the conventional electroformation without any confinement applied; yellow curve: the reported micro-confined electroformation by combining confinement-free electroformation with microcontact printing-induced lipid film micropatterning.
