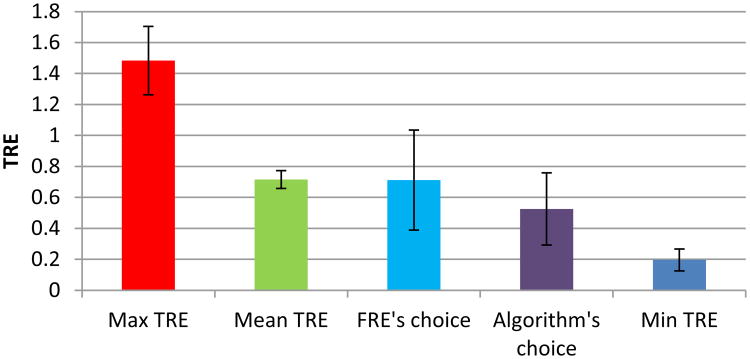
Figure 6.
Bar graph of the mean value and standard deviation of the TRE value across 1000 simulations. For each simulation we calculate the mean TRE of all 30 fiducial configurations, the min TRE of all 30 fiducial configurations, the max TRE of all 30 fiducial configurations, the TRE of the fiducial configuration that AQUIRC identifies as being of the highest quality, and TRE of the fiducial configuration with the minimum FRE.

