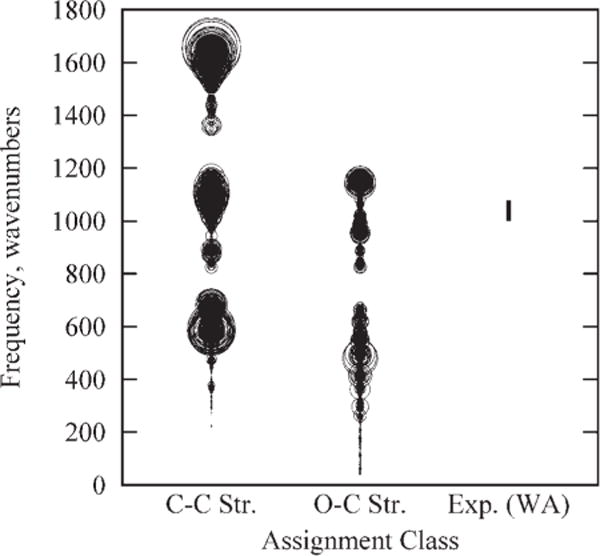
Figure 17.

Range of frequencies associated with C—O and C—C stretches as calculated by NMODE/GLYCAM for the 64-unit monomer. The figure includes all C—O and C—C stretches in each molecule, regardless of relative importance to the mode. Circle diameters correspond to the relative kinetic energy associated with the stretching motion within the mode (see also discussion of Fig. 16). The experimental range is taken from Wells and Atalla,71 and corresponds to “heavy atom stretches.”
