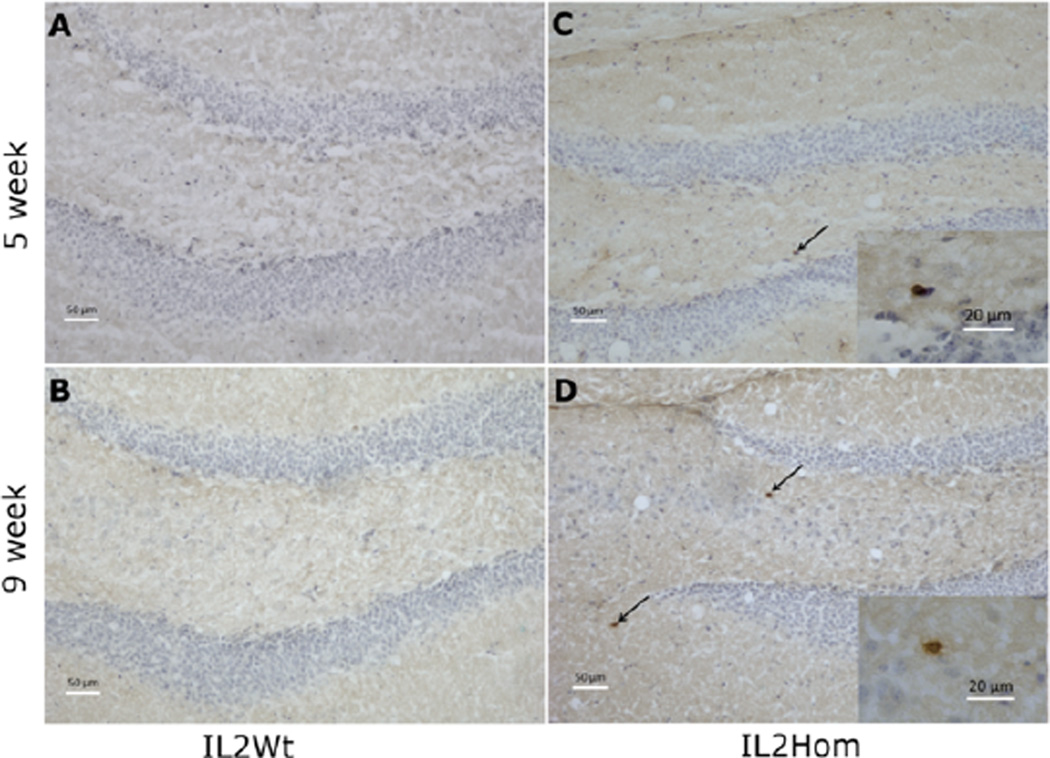
Figure 2.
Immunohistochemistry for CD3+ T cells in the dentate gyrus of 5 and 9-week-old IL-2Wt (A & B) and IL-2Hom (C & D) mice. High power magnification of T cells are shown in the inset of C and D. CD3+ T cells were immunostained brown and are indicated by arrows, while neuronal and glial cell bodies were counterstained with cresyl violet and are shown in blue. Scale bar=50 µm. Inset scale bar=20 µm.

