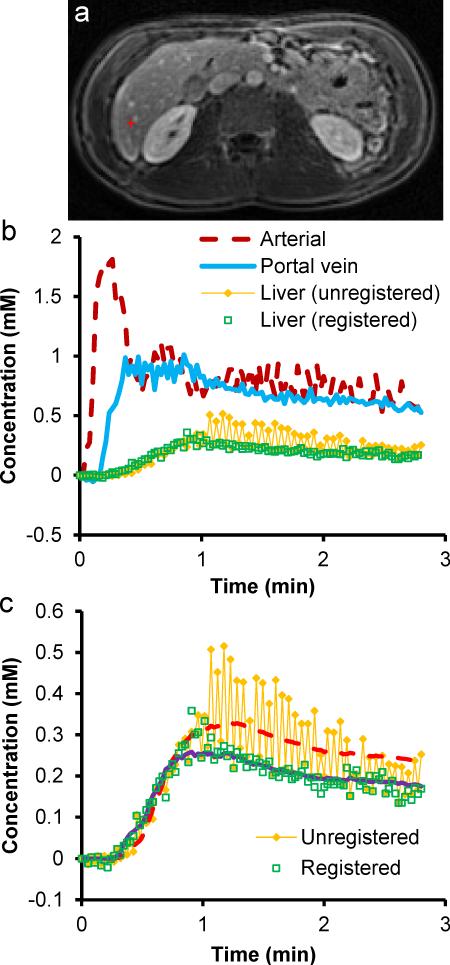
Figure 4.
(a) T1-weighted image showing a liver pixel close to a small vessel. (b) Concentration-time curves in the aorta, portal vein and the selected single-voxel liver tissue shown in (a). (c) Measured and fitted data of liver tissue using a dual-input single-compartment model. After image registration, the concentration-time curve is much smoother and the residual error from the fitting is lower. Substantial changes in arterial fraction, distribution volume and mean transit time were also observed before and after registration.

