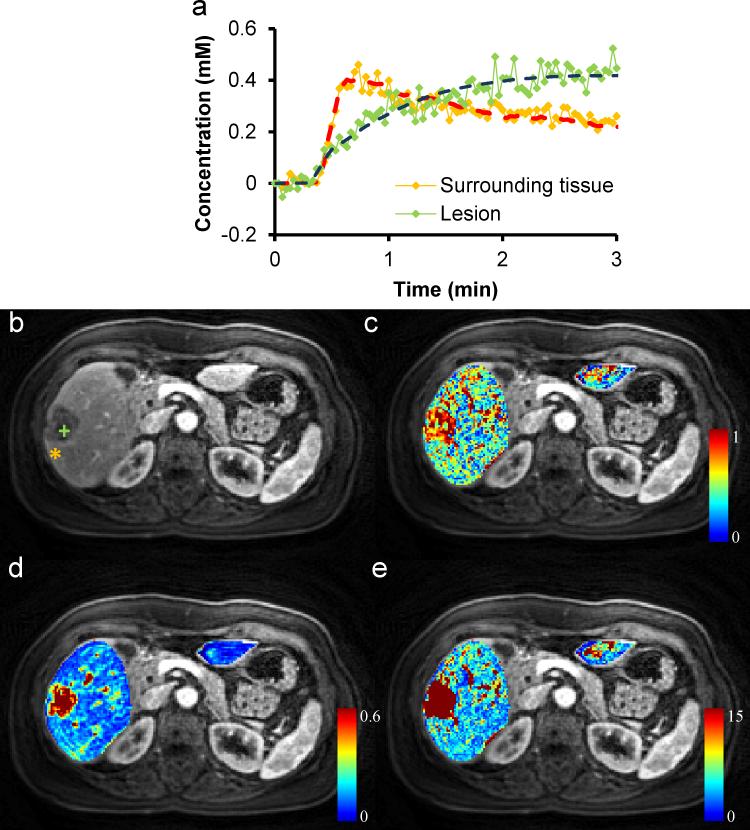
Figure 6.
Liver perfusion maps for the subject with metastatic breast cancer. (a) Representative concentration-time curves of both lesion and normal surrounding tissue as shown in the T1-weighted image (b). Corresponding liver perfusion maps of (c) arterial fraction, (d) distribution volume, and (e) mean transit time.

