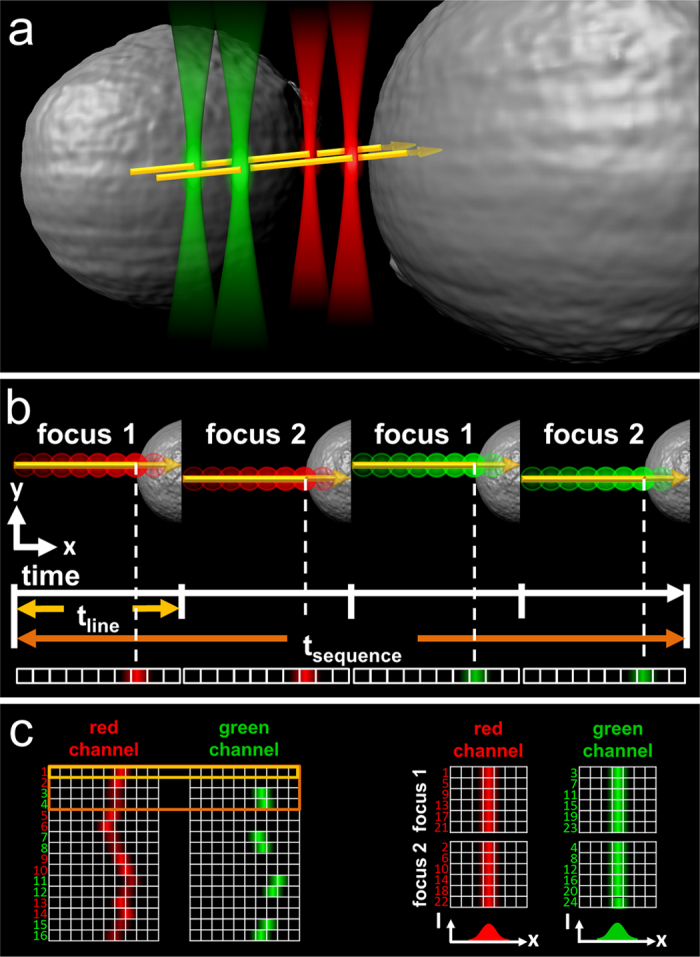
Figure 1. Data acquisition scheme of 2c2f lsFCS.

(a) In a confocal laser scanning microscope, the observation focus is scanned perpendicularly through the cell membrane along two lines separated by a small, fixed distance, and the excitation light is alternated between two colors (green and red). (b) In a single scan of duration tline (2 ms in our case), the fluorescence emission is registered separately for the two colors and binned in pixels according to their spatial position along the scan axis. A scan sequence of duration tsequence consists of four sequential scans, focus 1 and 2 with red excitation, and focus 1 and 2 with green excitation, and is repeated many times. (c) The intensities measured in all line scans are arranged as kymograms, where the horizontal axis shows the intensity as a function of scanner position, and the vertical axis labels the scan number. Membrane fluctuations during the measurement are removed by shifting the line data horizontally to a common origin. The data are separated into four arrays corresponding to one of the four line scans of the sequence. Fluorescence intensity time traces are computed from these data, from which correlation functions are calculated and analyzed to reveal the dynamics.
