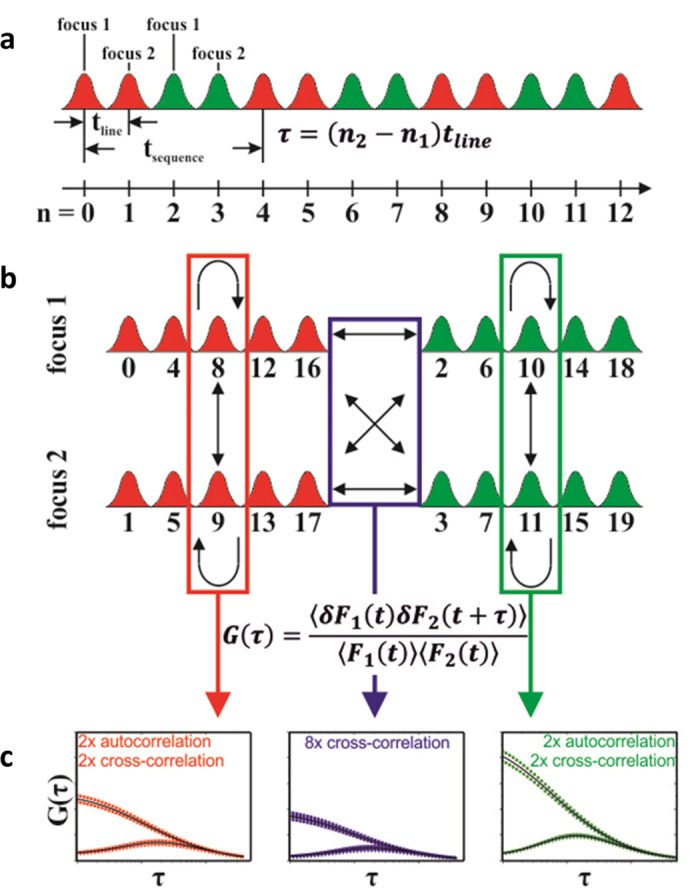
Figure 2. Data analysis in 2c2f lsFCS.

(a) Line scan intensity data acquired with repetitive application of the four line scan sequence: scans 1 and 2 at focal positions 1 and 2 (red Gaussians), respectively, with red excitation and detection in the red color channel, and scans 3 and 4 at focal positions 1 and 2 (green Gaussians), respectively, with green excitation and detection in the green color channel. Each line scan is numbered by ascending n, so the temporal separation between any pair of lines is given by τ = (n2 – n1) tline. (b) The data are rearranged into four intensity time traces, and four auto- (bent arrows) and twelve cross-correlation functions (straight and double arrows) are computed. (c) These 16 correlation curves are globally fitted to obtain diffusion coefficients and concentrations of the two diffusing species.
