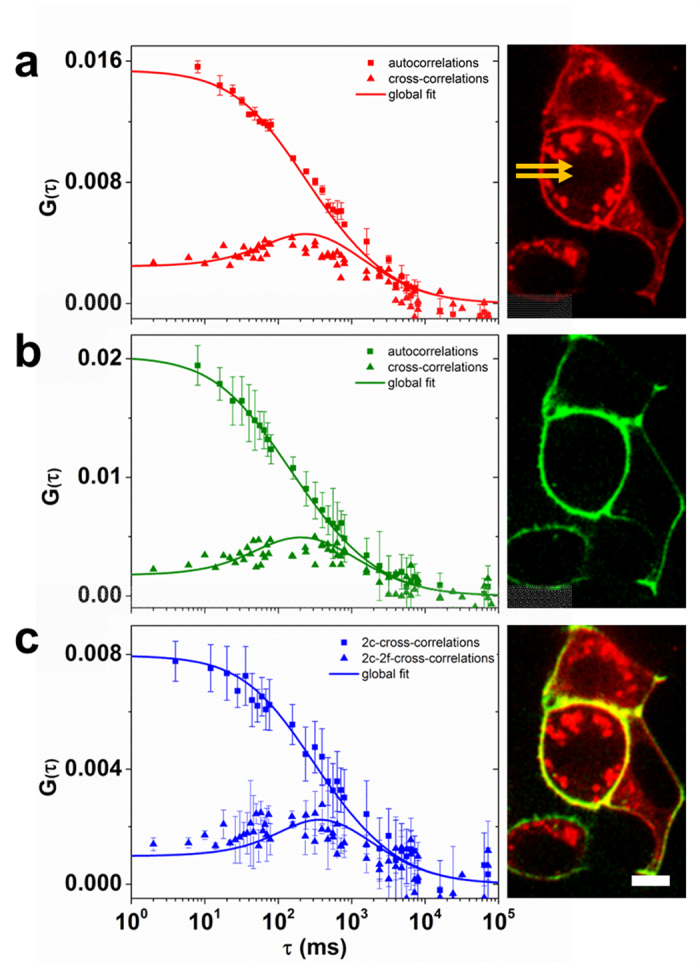
Figure 4. Measurement of Dkk1-GFP binding to LRP6-mCherry on HEK293T cells using 2c2f lsFCS.

Left column, experimentally determined correlations functions and model fits (symbols: data, lines: fit); right column, exemplary confocal images of a cell sample. (a) Autocorrelation and dual-focus cross-correlation functions and image from the data collected in the red color channel; the line scan locations are marked by two yellow arrows. (b) Autocorrelation and dual-focus cross-correlation functions and image from the data collected in the green color channel, (c) dual-color cross-correlation and dual-color dual-focus cross-correlation functions and dual-color image. Error bars indicate standard deviations from multiple data sets. Scale bar, 15 μm.
