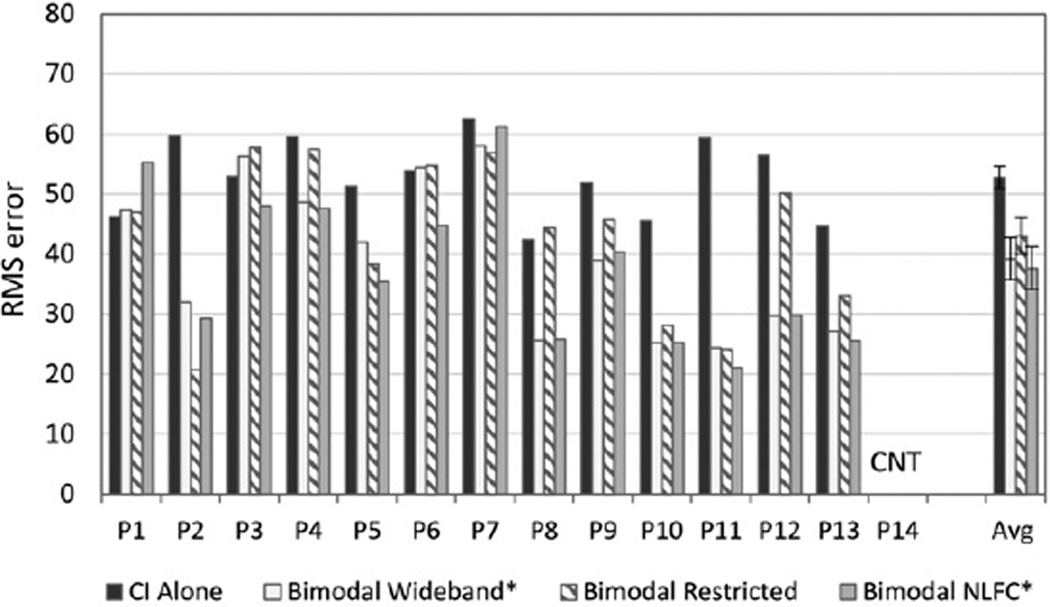
Figure 4.
Individual and group data are shown for localization. For each participant shown along the x axis, RMS error scores are displayed in dark gray for the CI-alone condition, and in three bimodal conditions: bimodal wideband (white), bimodal restricted (bars with angled stripes), and bimodal frequency compression (bars in light gray). Group mean and standard error results for each condition are shown to the far right.
CNT = could not test.
* Significant bimodal improvement compared to CI alone, p = 0.01.

