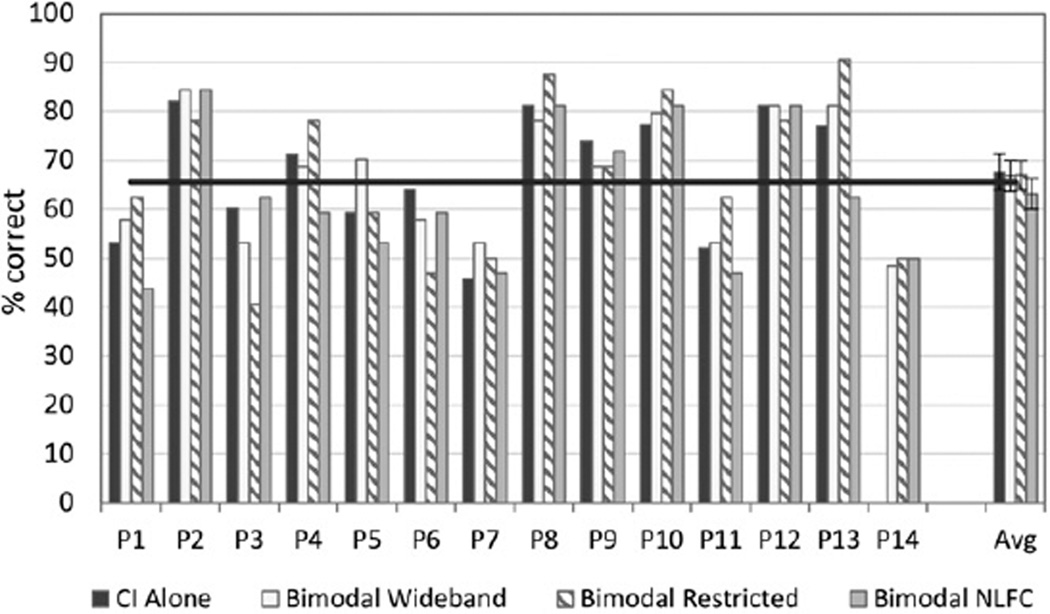
Figure 6.
Individual and group data are shown for female-talker discrimination. For each participant shown along the x axis, percent correct scores are displayed in dark gray for the CI-alone condition, and in three bimodal conditions: bimodal wideband (white), bimodal restricted (bars with angled stripes), and bimodal frequency compression (bars in light gray). Group mean and standard error results for each condition are shown to the far right. The horizontal black line at 65% represents the level at which scores fall significantly above chance. One participant was not tested in the CI-alone condition.

